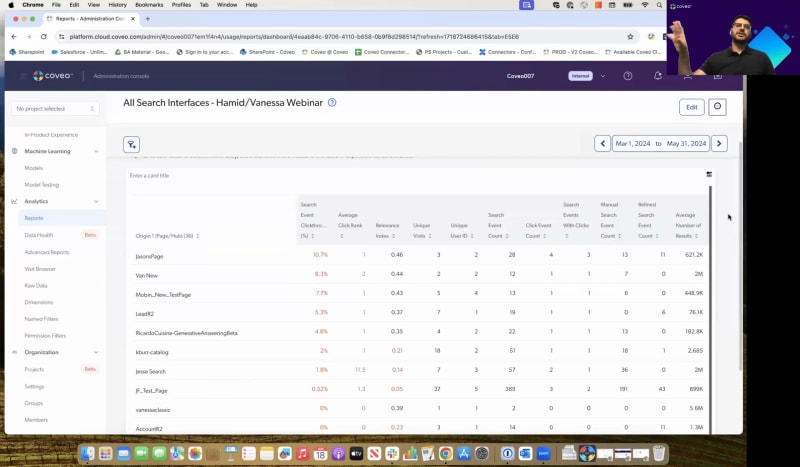
So as I said, my name is Evan Thompson. I'm director of customer experience, with Coveo. I'm joined today by Hamid and Vanessa from our CS team, and they're gonna be your lovely host today and our subject matter experts when it comes to the topic at hand. So what are we talking about today? Well, this is our second session of our mastering, relevance, and we're gonna dive into actually mastering analytics. So we wanna make sure that you guys have all of the need to know on what we need to do in terms of Kaveo reporting, the analytics, capturing the insights, and really diving in and understanding the metrics that are really at your fingertips. So with that, I'm actually gonna hand it over to Hamid. He's gonna walk through the agenda, and we'll dive right in. Thank you, Hamid. Sure. So hi, everyone. We're gonna we have a packed agenda today, but, please, let's keep this interactive. If you have any questions, stop us, raise your hand, put it in in in QA. James, no worries. Thank you for letting us know that our chat is disabled. So, please put your questions in in in QA. What we're gonna talk about today is measuring success. We're gonna go. This is one of the pain points that you guys shared in the first session. We're gonna talk a bit about the higher levels. So, you know, in general, how do you measure success? How do we how do we work towards reaching our business outcomes? Then we're gonna deep dig deeper into how what is the stuff that you can measure from Coveo out of the box related to those business segments. So we're gonna talk about the micro and the and the macro there. Gonna talk about understanding shift for performance, essentially, test performance, how where can we see, think of it, what are the signals that telling us search is working, good or not? You know, talking a bit more about the specific concepts of Coveo. Coverio is big for click through rates, content gaps, etcetera. And we're gonna show you a bit of a live, live demo in our org. Where can you access those reports? Which ones are already prepackaged for you? Right? So you can just download them and templates start work working with it. And then we'll wrap it up with with questions, and we'll share additional resources there. So, at any point, please put your questions in chat, raise your hand. We'll be more than happy to answer, answer all of that. Okay. One more piece before we dive in. I'm gonna quickly launch a poll. We really just wanna understand where everybody's at when it comes to understanding Kaveo Analytics, the capabilities, and what you might be measuring. So if everybody doesn't mind, there's two questions there. If you could quickly just go ahead and answer those, it's gonna give us a much better understanding of how to gauge today's topics and dive deeper into certain elements that you may or may not have gotten started with. We'll give everyone a minute and then take a look at the results. Alright. I see some responses coming in. Thank you. Just another minute here. Few seconds, actually. Okay. Let's end the poll. Share results. Alright. So it looks like a lot of people that are joining us today have actually started diving in. You're using the analytics. You're looking at the reporting, but it sounds like we have some newcomers as well and people that just wanna dig deeper. So we'll make sure that we're gonna dive deeper in, try and create some clarity there. And, of course, following this, we're gonna send the recording, but also some additional assets that are gonna help you keep moving along with it. So the main reason here that we're seeing for people taking a look at the analytics, everybody's looking at measuring what your key performance indicators are and the outcomes, of course, with Coveo. You wanna optimize that search experience, and, of course, you're looking at deeper dives and understanding some trend analysis. So this is awesome. I think we're right on point with everything that we're gonna be sharing today. So without further ado, Hamid and Vanessa, you guys can take it over. Awesome. Okay. I'm gonna, I'll talk about this slide one slide here, and then I'll let Vanessa continue. The answers are really perfect. I I I smiled when I saw them because it's really in line with this. So Caviar is gonna give you access to measure specifically search success. So you have, you know, our customers clicking on stuff. How is machine learning doing? What is what are the content gaps? What is the percentage of content gaps? So this is really readily available for you in the reports. But at the end of the day, we really have to think the bigger picture. So how can we how how can I stitch these all these little metrics and have them reach, you know, the business outcomes that's trying to achieve? These are examples. It's not it's not a complete list. But, typically, you know, we have four main, if you wanna say, LOBs lines of businesses or or or usages for. If I start with the website, from a waste website standpoint, we we in order to be able to to measure those outcomes, we need to know what's the purpose of the site. Is it just assembly and marketing presence for you guys just to show general info? Or is it more if you have if you're into health if in health care or, let's say, a law firm, is the purpose for the end users to be able to call the hospital, to call the lawyer, right, to fill a form where a lawyer can call you. These really need to be defined in order for us to say, okay. When somebody searches for something, they hit the contact us button. Then we send the contact us button analytics to Caveira, and we can measure. Out of, you know, out of twenty searches, seven of them hit the contact us button. This is how we kinda navigate success from a website standpoint. That's just one example. Also, if there is specific conversion rates, for example, like subscriptions. Right? You somebody goes that's at their entry point to the website. They search for things. They click it on, and then they have that subscribe here. Subscribe to a newsletter or even subscribe to our paid service. This this is the information that you need to look at because even if they click a million times, at the end of the day, if your goal is subscription and we're not seeing that, then we have a problem. So this is the one line of business, which is website. It's it might seem simple, but, honestly, it's one of the really ones that's hard really not not so easy to measure. Right? Because we need a direct correlation between clicks, between searches, between reduction in content gaps, for example, and subscriptions and, you know, conversions, etcetera. Then we have the workplace. Workplace meaning, essentially, internets. This one is is depending on what is how do you measure your Internet success internally, we can really attribute a lot of those things to. Example, your ESAT score, your surveys. We do we use surveys a lot Coveo, once per month. Some questions are really specifically about findability. Right? If I'm looking to to to see how many, how many, days in Canada we have or in Quebec we have vacations, Is it easy to find? Am I just say saying how many vacation is I have on getting the answer? Or do I have to really go and ask my buddy or maybe go on Slack or ask someone? This is all we we ask these specific questions, and and then we will come up with an ESAT score. Also, really important, onboarding time, customer onboarding sorry, employee onboarding time. We're not talking about your customers onboarding into your product. What for an employee onboarding time? Are do they have one hub where they can pretty much find all the assets they need to to to be able to to learn, to be able to train themselves? That's also something we measure, and we have other customers well, several customers will measure that with Coveo. Without Coveo, they do AB testings, etcetera. Then we go more into the things that we can measure it pretty straightforward. What from it, when it comes to commerce, the purpose of of ecommerce website's pretty straightforward. You wanna buy something. Right? So we can measure direct signals like revenue per visit, revenue from from from search, add to carts from search, and then average order value. Right? Because Kaverio, we have product recommendations. So let's say you add something to to to the cart, you're gonna get some recommendations from Coveo saying, oh, this is also a complimentary item. So we can measure this, and we can come up at the end of the you know, at the end of the day, we can say was able to increase the average, order value. Was able to to to increase the revenue, pay per visit, etcetera. So that's pretty straightforward. But, of course, key to all this is having good signals coming to Coveo. Sending analytics to Coveo is really key. If I'm not sending analytics to Coveo, I can't measure this. And, side note, machine learning is not gonna work properly. Last but not least, service and support. Service and support. What are we talking about here? When I go on a website so let's say the whole journey is I went on a website. I looked for I I I learned about the products. Perfect. I'm gonna purchase the product. I purchased the product, commerce. So we hit website. We hit commerce. Now I need to learn more about the how a specific error code gave you know, I got an error code for the product. What do I do? I will go to the community. I wanna self serve. So I looked for someone and couldn't find anything. I decided to open a ticket. This is where I'm gonna go to my case creation page and start filling out, you know, my case form. On the right hand side or through case assist, we're gonna see, I I see that this is how I solve error code or even through our CRGA. I click on it. I cancel. I'm not gonna open a ticket. That's really straightforward. How many cases I was able to deflect in a month? How much does each case cost? Thus, this is how much Coveo was able to to save for you. Also, there's the agent side of things. Right? Because Coveo is also plugged in into an agent insight panel where as agents are working on cases, we are providing them with with recommendations how to solve the case, attach to the case, etcetera. There, same thing. We could we could measure, for example, case handling time, case successful case closure. Did Coveo help? How many how many KB articles are being attached to the cases to to to serve? This is all gonna be under the sub service and support umbrella. So as a summary, before getting into the questions of how can Coveo up how can we optimize search with Coveo, It's more of what are we might try to achieve because maybe the numbers are amazing, but I'm not seeing conversion rates. Then we have a problem. So keep that in mind, business outcomes on top, and then we go into the more knitting really, which is the search, take through content gaps, etcetera. Next. Vanessa, do you wanna dig deeper into the search optimization part of things? And, please, if there's any questions, we can I'll take them in QA, and I'll also help you answer. Perfect. We're good for now. Awesome. Alright. So exactly what you said. I think it's really important. So as a CSM, we often get the question, you know, how can we optimize, or use usage analytics to create a better search experience? But it really starts from us also understanding, like, why you why you purchased Coveo in the first place and how, we can help impact your business as well. So that said, a lot of the time as a CSM here at Coveo, sometimes, you know, with customers, you I hear that it could be the case where you're coming from another platform, with a different tool, where you looked at analytics a little bit differently or maybe didn't have the right tools to actually measure search performance, or you didn't even have a previous tool, coming over to Coveo. So something we always like to share is, you know, how much we can actually use, data and analytics and insights to actually create a better experience for the end users. So you'll hear a lot of the time, with us in customer success. We talk about relevance tuning or if you take any of the level up courses. What this really means is that we are using analytics, to actually, as the kind of starting place on how we can better optimize your search. So we'll look at things like content gaps. You know, what are users looking for that they're not finding? Is there any missing content? Is this an opportunity to even add new content to Coveo that might not even be indexed? So all in all, usage analytics, really, really great place to start to better the user experience. And in the Coveo platform itself, which Hamid will get into, we have tons of reports and dashboards, tons of, templates as well that you can play around with and use, based on different context and use cases. And we also have the ability to fully customize these reports and dashboards. You can even add custom dimensions. So if there's something specific you really wanna measure as part of your business outcomes, that's also possible as well, which, maybe we'll touch on a little bit today, as part of the platform. So from a Coveo lens, I'll just share kind of some key factors before we actually get into the platform, that are really important to consider when you're looking at Coveo reports. So there's three, big things that I always share with my customers. You know, know, keep this in the back of your mind when you're looking at any sort of reporting related to search performance, and the first is availability. So at Coveo, whatever content is being returned to the end user is gonna be any content that's been indexed. So keep in mind that, if you don't have everything indexed, to Coveo, that might affect the results that your end users, are gonna see. So maybe you have a lot of, you know, you have YouTube content, you have web content, but maybe you also have SharePoint content that isn't indexed to Coveo, and that might be an opportunity for you know, to add that content that users are actually looking for. Mhmm. But it's really just here to say that, just keep that in the back of your mind. If you see, like, large content gaps, it's gonna be affected by whatever you're being whatever you're indexing over to Coveo. The second is accessibility. So you have that index, in Coveo, and you also should keep in mind, that accessibility might affect the results, that the end users will see as well. So there's kind of different levels of permissions. So if you have different sources, indexed over to Coveo, those might also hold different permissions, in terms of, like, what the end users might be able to see. Is the user logging in? Do they have to authenticate? Some of those factors might, also play into what you're seeing, in reporting. And lastly, in terms of relevance, so if you've added any rules into your query pipelines or you have different audiences that are searching differently in different contexts, this will also affect kind of, you know, the things that you might see in terms of your Coveo search metrics. So, again, how is machine learning learning? Is it learning from different user behavior? Do you have different types of personas and users? Do you have different rules in different instances? All of this will play into what, you will see in terms of reporting. So we wanted to touch on some key concepts as well before actually diving into the platform. And Sorry to cut you off. I have a quick question. Yes. So, how would it work if I have permissions in my sources already? What could be your permissions Override it. What do you mean? Like, So, I think so it means, if I have let's say, if I understand correctly, if I have permissions in Salesforce, right, would Coveo have its own permissions, or how does it work? Yeah. So whenever you index content to Coveo, you can, add or edit the permissions on the source as well. Is that kind of what, they're asking, like, in terms of at the index level? If you don't do anything to it, we're gonna copy the permissions from from the source. Yep. But you can still, of course, add some modification there. But by default, Caviar will go and, index that price in. Yep. Yes. A hundred percent. Is there any other questions that we wanna take? Sorry. I I didn't talk to Jack. No worries. We're good. Sorry. Thank you. Perfect. Alright. So in terms of key concepts, so you're we're gonna be looking at dimensions and metrics, which will show in reporting. So if ever you were to go build a report and play in the sandbox, your Coveo sandbox, for example, it will always ask you to add a dimension, and it will often ask, for a metric as well. Sometimes you'll even see just a metric card, things like visit metrics, etcetera. And so we just wanted to define this before we actually go in and and show you. So at Coveo, when we talk about dimensions, we're actually looking at the what. So what are we actually looking to measure? Example, let's say we want to see, you know, how many visitors are coming from a specific country, a device, or a browser. This would be a dimension that we can use, in reporting. So it'll look like, you know, you can select country, device browser, exactly those as dimensions. And if you wanted to see the ones, that are out of the box, we have approximately seventy in the actual, platform under a a tab called dimensions. Maybe we can show that as well if we have the time. And you'll notice that, they're going to be divided by click, search, and even custom ones if you have any as well. And on the flip side, so it's always going to ask, you know, what, you know, what are you what are you looking to, measure on? And the metric side of things is going to be the how much. So you can define how you actually want to quantify what you're looking at. So it could be, number of visits, by a country. It could be number of unique visits. You can look at number of clicks that are happening, in a specific country. So you can really define the numeric value or the how much of, the what that you're looking at. So there's a whole range of those as well that, you can explore, but we just wanted to share that maybe these are new concepts that are more Coveo terminology that might be a little bit different from your current platform, that you might be used to. Alright. So we also wanted to share, our Coveo search performance metrics. So these are four different metrics that, as a CSM here at Coveo, I'm really interested to look at with my customers because they provide a lot of insight into how, the search is performing. So the first one here that you'll see, is the content gap ratio, and what this is looking at is, really the, percent of results. Sorry, the percent of queries or searches that returned zero results. And, ideally, you know, we always say, like, you'll see in here in brackets, this should be less than five percent. What this really means is that we want the majority of users that are coming on to query, to provide a result. So if that number starts to get too high, what this looks like to us at Coveo is that this might mean, that there is users are looking for content that actually isn't indexed to Coveo or maybe is content that isn't even created, that needs to be created, by the business. So it's really insightful to us, and we focus a lot of time here, especially at the beginning, on this metric. The second is average click rank. So what this looks at is the actual, position of an open item within the search results list. And you'll see in brackets here that it says it should be equal to or less than three. What this means in very, very simple terms is that on average, we want users to find the results, within the top three placements of a result list. So if that number starts to dip closer to, you know, five and then ten or maybe even higher numbers, that would indicate to us that users are having to scroll really far down a page or maybe even click next to find results. And this kind of tells us that, you know, the results might not be super relevant and presents a really good opportunity maybe for, to add a machine learning model like ART that helps with this or maybe even a featured results or a results ranking expression rule to help boost content to push it further to the top. So, again, a really, really great metric for us that we look at, you you know, from a customer success side customer success perspective or, side of things, it it's really insightful to us. And the last two here are going to sound pretty pretty similar to each other. They're both click through percent metrics, but there's a little bit of a nuance between the two. So the first one here, visit click through, is basically going to look at the percent of visits that resulted in at least one click on a result. So it's not gonna take into account how many steps the user took to get, you know, to actually click on a result. It's just gonna look at, did Hamid come on to, the website, and did he click on a result? If he did, that will give us, you know, a hit into the visit click through metric. So it's a good measure of user engagement with the site. You know, are users coming on, and are they finding or clicking on, our results? On the right side, you'll see search click through percent. So this is a metric that actually will look at how many steps, the user took to actually find the result. So it's going to say, okay. Did Hamid come on? Did he conduct one search? Then did he maybe have to do a second search or maybe even click on a facet or a tab to actually end up clicking on a result? And, that will kind of indicate to us, this search click through percent here. So higher numbers are better for these metrics, meaning that, users are only needing to, let's say, only do one search here and click on a result versus they had to do multiple or take multiple steps to actually, find a final rule final result. So as they take more steps, this number would essentially go down, over time. So maybe we'll take a pause. I don't know if there's any, questions I made. If not still good. Okay. Awesome. So I will pass it over to you, and we can get into, the platform. Awesome. Alright. Can you guys see my screen? Yes. We can. You're all good. Perfect. That's great. So now let's go into from the theory a bit more into the practical side of things. So I am in in in Kubei double seven. It's it's our internal org. In your case, you're gonna go to your production or nonproduction instance. If you do not have access, to to your to your non prod or prod, you can ask an admin, from your end to to to give you access access. It could be read access. It could be access to certain groups. It doesn't have to be an admin access. It could be just for reporting. So do that also very interesting. If you guys want, we can create a test org. Right? And test things is what you know, the way you want without even having to go to non prod. Has some limitations, obviously, but I think the core functionality that we can we will demonstrate here, you are able to also, see it in in in any of our org. So before I before I get to that, I I actually wanted to to to show you guys something. So when Vanessa was talking about dimensions, the first thing that got to my mind, oh, we have predefined dimensions, which is what you're trying to measure. Can we add dimensions? Can I send dimensions from my UI? To do that, we can, but I'm just gonna give you a quick hint. If you go on our docs page, just search for custom dimensions, for instance, you're gonna have our beautiful generated answer. It'll explain to you what are custom dimensions, how you can add it, etcetera. I know several of you actually already leveraged this on on your on your on your UI. That's just more of a teaser. Also, you can you can click on on one of the results to learn more about it. And this applies to any concept we discussed today. Our docs, our community, you're gonna have access to everything at your own pace level up as well. So just wanted wanted wanted to mention this. Now let's back to let's go back to our reports. On the left hand side, if you navigate to, analytics reports and then go to add, You you have bunch of options here. We're gonna start with the easier ones, so we're not gonna really go into deep how to create reports from scratch. We will start with the templates. In my opinion, the templates should serve at least ninety five percent of your needs. So when I choose dashboards from template here, gonna have a bunch of option options. You have the general general interfaces, summary, trending documents. We can go deep into machine learning. If you have our our CRGA generative answering, how is it performing, what are questions that are being answered, thumbs ups, thumb downs, how our query suggestion is doing smart snippets. If you guys have smart snippets as well, this is specific for that. Then remember the LOBs that I talked about? We have specific self serve reports, which will show you metrics around case deflection, if you have case assist, and, additional questions there. Also, we can go deep into the it's called advanced, but in my opinion, this is this report to your search performance. If there's one report that I suggest you guys go and download, play with, would be the search performance report, which I'm gonna walk you through, through it as well. So that being said, I'll walk you through to before I go into the search performance, I'm gonna go into something called the all search interfaces first. Is there any questions before I load this? Yes. We have one. Can we move reports from non prod to prod? And I don't know if you're gonna touch on this, but great question. Yeah. I'll answer it in two seconds. So when I click on I'm gonna download essentially or or or up upload, actually, this report to to to my to my, to my org. So I'm gonna select this template called all search interfaces. I will load it here. So it's loaded. I can basically call it whatever you want. Webinar. Save. Now you're gonna have it in your list of reports there. So why do I like this report? Couple of reasons. If you have multiple search hubs, search hubs for for for whoever's, super new to prevail, Search hubs are essentially your front end, so your UIs. If you have multiple UIs, multiple pipelines, maybe with multiple use cases, one commerce, one website use case, etcetera. I wanna know what's happening, what's happening in every single search hub. For example, in our test, I know that Jason's page has this click through rates, which Vanessa talked about, this average click rank, this number of visits. I'm gonna add another thing here which will help you dissect because I know we got offline many questions around where is every search hub pointing to which pipeline? Why do I have, search hubs that are not pointing to pipelines? Gonna do a bit of trick here. Once I go to edit, if I edit this specific part and I simply add pipeline, search pipeline, save. Now I am able to see globally when this loads. I'm able to see globally which every page, every hub is pointing to which pipeline. Meaning, if sometimes you have weird results, like, I I added it to source entry. Why it's not applying? Did you add it in the right pipeline? This is what's gonna tell you as a global view. So that's that's a really, really important, report that I that I really suggest you add it. Keep in mind, I added it in three clicks. There's nothing custom. The only thing that I did, I added pipeline here just for my own sake to see the the the pipeline, how it points to a search. Now to answer the question about can I move reports from one organization to another? Yes. How do we do that? A bit manual, but pretty straightforward. So I'm gonna if if you go into, more, I have several options right here. So all these reports are created through, JSON. What you need to do is copy to clipboard. Right? And then you're gonna go to your org. Let's assume this is, this is the other org because I don't wanna show you the list of queries we have access to. We're gonna go here. We're gonna add a blank dashboard, and this is documented as well. We can send it to you. And then you're gonna click on the three dots. You're gonna paste that JSON you copied. Once you paste it, import and save, and that's it. It's gonna be carried over from prod to non prod, non prod to prod. Note, all the filters will be carried over. So if you have filters, on top of the report, it will be carried over. Make sure if there's any differences between the search hubs, pipelines, whatever in your filters to change it to to to mimic the actual, the actual the actual org you're looking at. That's my only, my only consideration there. Hopefully, this answered. Perfect. Now let's add another, report, which I told you earlier. That's the report that I really recommend you guys, look at first things first. Search performance. Select the template. It's gonna ask you okay. Because this is a specific report. It will ask you which search hub you wanna point to. In this case, I'm just gonna choose, let's say, Jason's page. In this case, Jason's page is is a search hub. I'm gonna add the report, and then here you go. Let me save this. Now my filter on top is JSON's page, but we can remove it. So let's remove it just to look globally at all, all search apps. This is pretty busy as you could as you guys see. You have summary knowledge, health check, blah blah blah. I'm gonna go couple of those who are which which which are, in my opinion, are are the most important ones to focus on especially after. First of all, the knowledge library, this is definition of everything that they're gonna see here with links, hyperlinks to our community and our docs. In case, again, dimensions, you know, what dimension is, you can click here, you can learn it, and and and whatnot. So in my summary tab, this is think about it as your quantitative report. Right? What does it mean? Means what are the number of searches? What are the number of clicks we're getting in general? How many unique visitors we have? How many unique visits we have, then what are the, visits per device, visits per country. So all the pretty much out of the box dimensions, we can add them here. And these can be modified based on your needs. Example, if you are based in Canada only, right, and you want instead of country, you want city, we can change this dimension and say, just show me the different cities. Where are we getting those, those those dimensions from? If it's a website use case, we are not saving any customer data, obviously, but it's in the cookie. Right? The customer, the user, if I look here, it's gonna be it's gonna be anonymous, but we have it in the cookie, which is the language and and all these these these stuff. That's why him, if we clear cookies, we're gonna clear the visit, visitor ID. Anyway, one question that I always have is what is the difference between a user ID and the and the and and and the visit? So a visitor ID and a visit ID. And this is standard for most software. A visit so an interaction with Coveo will last as long as I am doing something. Example. If I start to search and then I click on a facet, click on on on the result, go back, use CRGA, All this, as long as I'm I'm still active, this is gonna continue to be the same visit. When I'm inactive for thirty minutes, the visit ID will reset, but my visitor ID will not change unless I click cookies. Meaning, you're always gonna see the number of visits higher than the number of visitors. Right? So that's that's just to keep in mind. And why are those metrics important? Because they're gonna feed into my search event click through, my visits click through, etcetera. The second section of this first, first tab would be also quantitative, but more details. Alright. Between May first and May thirty first, what were the top queries? Top manual queries? ID, customer success, jacket, locator, phone, etcetera. In your case, it's gonna obviously make more sense, and you will be able to better understand trends for that month, With any again, just an example website, use case, if there's a very particular event, you're gonna see it trending. If you are an education higher education, organization, you're gonna see during registration, most of the queries are, how do I register, how do I drop, where's the registrar office, stuff like that. Then in summer, you're gonna see more of, is the gym open? Can I park here in summer? Right? Do we have summer classes? So these trends, you're able to to manage here. And, of course, you can change the date. You can add filters, etcetera. Then we can see what the top documents clicks. We call them documents, but they could be web pages, PDF, pretty much any link that the customer is actually clicking on. Right? So that's that's really important, also to measure, and we'll see basically what what are the the the documents that are really getting value to my customer. Then last but not least, top query top, manual keywords. The difference between queries and keywords, keywords are just subsets of queries. Customer success, customer is the keyword. Success is the keyword. That's really important for, for what's trending as well because customers would ask things in a different way. As long as I can pick up key, key keywords, I know if, you know, what's going on. I know how to tailor my results as well. There's additional stuff if the customers are logged logged in, what would be the username, and then we have the top sources clicked as well. I'll take another pause and see if there's any questions, Vanessa, or if you answered any questions, maybe you wanna repeat it. I think we're good for now. All are answered. Beautiful. Alright. Now that we talked about the quantitative side of things, let's talk about the qualitative side of things. That would be our health check. Remember the conveyor's big four, metrics that, Vanessa talked about? How do they translate in our report? That's how they translate. I have an exact percentage of the visit click through, how many customers visited search as in start to impact with Preveo, how many of them clicked on something. They could click once or a million times. As long as they click once, it's a it's a it's a successful visit. Then from search click through, average click rank, and, obviously, content gaps here. And, of course, you have time series. Right? So you can see if machine learning is contributing positively or negatively to the visitor. Is it going up? Is it going down? If it's going down, we have the problem. Right? What can we do there? Same thing for a content gap, which is a no no for search. That's the awful thing you can get is when you search for something and have more results found, especially if you expect to have results found. This is a pie chart which shows you we have fourteen percent content gap, eighty or eighty five percent, of of queries have content. Now you might wonder, perfect. I have a number, but it really doesn't mean anything to me right now. Can we see those content gaps? Definitely. We have this will take me to the next tab, the following tab, sorry, which is called content gaps and query performance. Once you click on it, it's gonna show you the exact queries that have content gaps. Also, there is couple of additional dimensions that we added here to make sure we we can we can we can know exactly if this is an actual content gap, or is it more of a user user behavior, content gap, or whatnot? Give you an example. If you are on a on a, commerce site, and so you load the page, you load the your page of all the all the articles you're selling, and I'm I'm assuming I'm I'm I'm selling, electronics. And then I click on a facet called LG televisions. And then in my search, I search for Sony dryers. Right? I can't find anything. Why? Because I already filtered out Facets are essentially filters. I already filtered out the content to only give me LG television, and I'm searching for LG televisions within, sorry, for, Sony dryers within LG television. Does not make sense. So this is what we call a fake content gap because it's done by the user. We don't ignore this. We actually see if it's happening a lot, then there's this user behavior thing. We need to give the users more signals to be able to to to to serve themselves. And, thus, we add a facet value tool. So we see when somebody searched for pure WIC, was there a facet clicked? Also, which tab were they on? You might have multiple tabs like the all tab, the content tab, the product tab, videos. If somebody's looking for a YouTube video in the YouTube video tab, but there's no videos. They're gonna not get results, but we have knowledge based articles on that. So this is just putting putting giving you basically the first step into dissecting your your content gaps. Tip pro tip. Always look at the search event count and the unique visits because if one person tried to search for something, did not find it, it is pretty much insignificant if seventeen people search for something thirty times and could not find it. I need to always focus on, you know, the the the more people are trying to find something, they can't can't find anything. Definitely more than one person because there's always this somebody who's types typos that are completely off, even machine learning or did you mean cannot catch them? We have to take this into consideration as well when we are dissecting content gaps. We will do a session specifically on content gaps, troubleshooting. For now, just take it high level, high level, and and you can use our our docs to to get into more details. Or you can speak to your CSM for sure or send an email to the customer success index. Now on the right hand side, query relevance. Alright. So I have a query that does not have a content gap. Amazing. How do I know if it's a what's a good query or not? At Coveo, we have what we what we call the relevance index. Relevance index is a number between zero and point ninety nine, zero and one. The higher the number, the more relevant the query is. How is this number built? It's Kavio's secret sauce. But it's really not secret because it's gonna take into consideration your average number of results. The how many customers search for this? What's the average click crank after this query is searched for? Right? It will take all those before. It'll take all those behaviors and will provide a a a relevance index. If I in this example, if I sort by higher to lower, as you can see, we do not have because it's a static environment and you have multiple languages, we don't have great relevance index index numbers. But in your org, you're gonna find the number here more green, which is higher than point six or point seven, and this is good. So those queries that have a higher relevance index, I wanna learn from them. Right? I wanna learn why are they good. My content must be good. It's a popular search, etcetera. And on the other hand, if I sort sorry. If I sort by, lower to higher, you're gonna see some numbers in red. In red, they are less than point three, and this is where we need to do some work. In this case, mhmm, CSM, there's a lot of searches. There is a lot of people trying to search for it. For example, a lot of, number of results, a lot of results coming back. Customers are are not clicking. Why? Is it too broad of a term? Maybe. Is the content buried? Maybe. So this is where we would need to also do investigation to make sure, you know, we we we look at those, queries with with, a very low, RFS index. I'll take another pause and ask if there's is if there's any questions. We did get one in the private chat. It was just around, like, is it possible to manage the access of a report to hide it from a specific person? Great question. So there is two levels to this. Level number one is the general accessibility, which under your if you're an admin, if If you're not an admin, you are not able to see that in the org. But if you go under organization and they go into groups, you have different default groups. You have admins, analytics manager, analytics viewer, content manager. Each one of those groups give you access to edit or view only reports. So that's your first line of defense. Right? If you are part of the analytics managers, you will be able to see all reports and even change them. If you're analytics viewer, you're able to only view those reports, but we can go a level deeper. If I look at this report that I just imported, the all search inter interfaces, and I double click here, what you could do, if you click on the three dots, if it lets me click, right, you can go to manage report access. Here, as you can see, anybody with analytics privileges are able to see it. Maybe I'm working on it privately, and I don't wanna but I don't want it to be published yet. I can say only for me because I'm logged in. Maybe I want to have it accessible only to me and to Vanessa. So what can I do here? I can say, you know what? I can choose Vanessa. Last one here. That's it. Vanessa and I can only see that. And here, it doesn't have to be members. Right? It could be a, custom group that I created, and this group contains me, Devin, Vanessa. That's it. Cheryl. That's our group. So, again, I can choose here from group and add identity. Once you apply, only those people you specified can can see. That's a really good question because we we get it we we get it all the time. So thank you for that. Nice. So let me go back here. I'm gonna cover it to this is too big, so let me just make it from May as we're doing before. I had my filters to a year, which is gonna take forever. So, there's two more things I wanna show you. One, machine learning. Alright. Machine we have machine learning specific reports for smart snippets, for CRGA, query suggestion, etcetera. But they're really machine learning one on one, which is ART, automatic relevance tuning inquiry suggestions, we intentionally put it here so you can have visibility to it without adding another report. ART, for those new Coveo stands for automatic analytics tuning, and it's basically machine learning giving more scoring to certain content based on user journeys to push it more on top of of results. Right? Instead of it being number five, machine learning will learn that it's a famous content. Most customers with the same profile clicking on it, then it will start to creep up to number one, two, three, etcetera. How how are we able to to measure the ROI machine learning? First of all, I'm able to say how many of the visits have clicks on ART. In this case, it's test, so the numbers don't make sense. But, typically, when you go live, this number is gonna be low because machine learning needs time to to to learn. Right? After maybe ten thousand, twenty thousand clicks, it will learn enough to start to influence more and more the visits. At one point, if everything's going well, you're gonna see that the number of clicks on ART is actually higher than the number of clicks with RTRT. Makes sense because the more they click, the more it's gonna be on top. The more it's on top, the more they're gonna click. So that that makes sense. And then we can actually compare apples to apples and say, when machine learning influenced the result, what was the average click rank? So in this case, for example, the average click rank for standard queries could be five. Average click rank for queries that are pushed by RT, it's more of one or two. Also, very similarly, query suggestions. Right? Query suggestions would be, type ahead, essentially. In the search box, as you're starting to type, you're gonna be suggested some some some queries. Those queries are part of machine learning, and we are able to measure what is the click through of documents if the user clicks on a query suggestion versus if they don't click on a query suggestion. That's essentially an art literally an ROI how machine learning is making the, the customer journey, even better. And we have also same thing, the average click rank there. So I really recommend you guys look at, machine learning tab in your board, and definitely share with us if you see something weird. Like, if this number is zero and you have ART, it's been going on for three, four, six months a year, there's a problem. Either by the report in the report or maybe we are not tracking stuff properly. So I really encourage you to look it up and and and share share share your findings with us. Alright. There's more. Please look at it yourself. There's a lot more here. Those are the ones that I'm gonna look at on weekly basis if if I'm I have my own org. There's more that might be more important for you. Like, if you want to see the facets behavior, tabs behavior, we also have that for you. We are, approaching the end of this session. So and I really want to show you one thing. This is specific. We have two specific reports. One for CRJ, one for self serve. I wanna show you the self serve as the service one, which is community, etcetera. That's available, and it has been updated, recently. So if you scroll into self-service here, we have self-service and case deflection, template. Once you click on it, it's gonna ask you a couple of things. What is your self saver photo, which essentially your community? If I choose your JSON page, and then it's gonna tell you, what is the knowledge or problem user issues. So most of the times, this is most of it started to be the knowledge based articles. Right? The other things that are solving customer's problem. Or in your case, it could be something else. Maybe you have you are exposing cases to everyone or something like that, and they learn from cases, then you would choose cases solve most of the customer's problems. And then what is the case creation page? In this case, if I look at any page here, same thing. It's gonna what is the actual button that's clicked on to submit a case. It's also a custom event. All this to help you build the report easier instead of getting into every single, table and changing the dimensions there. So once you add the report, it will build three tabs for you. One is summary. Summary meaning, you know, how many visits is the community getting? How many clicks is the community getting? Right? And then we're gonna get into the more details like self-service. Mhmm. Self-service. What does it mean? Implicit case deflection. Explicit case deflection. All this is here. Won't go into the details, but it's available for you to measure. And then we can also add some some custom, I wouldn't call it custom, some out of the box, small, cards, which tells you, alright. My cost per case is hundred dollars. Right? Let me multiply it by the number of cases I'm deflecting, deflection. Also deflection. Also have another tab about self-service. This is goes into more details as well. Content gaps, clicks on ART and the self-service, etcetera, and then, obviously, case deflection drilling deeper into into the summary as well. So if you have a self-service and or case deflection use case, look at this report. Even if you already have your report set up, look at it because it might have some some stuff that you might wanna leverage for to measure success as well. Cancel. Last thing, if you go to add, dashboard from template, scroll down to your CRGA performance, Select the template. And if I choose this here, you're gonna choose the specific dimensions, specific search hub where the CRGA is is created. Once you add the report, you will be able sorry. I'm gonna add it because it's gonna be empty. You're gonna get all the results here that you can see. For example, custom contacts. We will see which queries are getting generated answers, right, which queries are not. And when we get a generated answer, is the click through rate going less? It should because they're get finding the results here. Also, we can measure clicks on citations. We can measure the thumbs up, thumbs down to learn which queries are really not doing well when it comes to Chennai or we're doing really well. So all of these interactions, we can measure it, and it's pretty much out of the box for you guys if you already are live with our CRGA product. And with that, I'm gonna stop sharing and ask if there's any questions, any comments. Hopefully, this was helpful for, for the whole, audience here. No questions. I think Vanessa's got one more slide we'll just talk about in terms of assets, and then I can close the loop on, next steps. Yeah. Perfect. So we just wanted to share some additional resources on everything we spoke about today. Of course, you have our Coveo Connect, community. So if you click on any of these courses, you'll be led, to our level up training platform. So this is where you can find self paced courses. So we have our Coveo fundamentals, and then you have more deep dive type of courses, such as this one, investigating unexpected queries. That's a little bit more advanced than today's session, and some documentation. But I think that's it. Thanks, everyone. Awesome. Yeah. Thanks so much, Hamid and Vanessa. This was fantastic. Just really quickly, guys, we're gonna be sending out the follow-up. I'll include the resources as well as the recording so you have access to that and can revisit it. Part of that will actually be a little bit of a a quick survey. We just wanna know more about what you guys wanna learn. What what's really troubling you right now? Where can we jump in and help? You know? What are we missing in terms of resources? So we're really trying to kind of uplevel what we're doing in terms of practical type webinars to ensure you're getting the most out of the Coveo platform as well as making sure we can redirect you to the areas that you can self serve. So, last thing, July tenth. Before we get too deep into our vacation time because I know everybody's likely eager like me to take a little bit of time away from work. But we've got our final session of this three part series, and it's going to be relevance tuning with the pros. Vanessa, Hamid, myself will be here, to close this session off, and then we're gonna be planning what's up next. So if you haven't registered, I'll also include a link there. If you're not able to join, you will get the recording if you've registered. Nine eastern here. So we've made it through a full hour, kept it on time, nine eastern here. So we've made it through a full hour, kept it on time. Thank you guys for joining. Thanks, Hamid, Vanessa, and, hopefully, we will see you next time. Take care, everyone. Have a great day. Yeah, everyone. Bye. Thanks, Devon. Thanks, everyone. Bye. Thank you.

Mastering Analytics: Insights, Metrics, and Beyond
Make every experience relevant with Coveo


Hey 👋! Any questions? I can have a teammate jump in on chat right now!