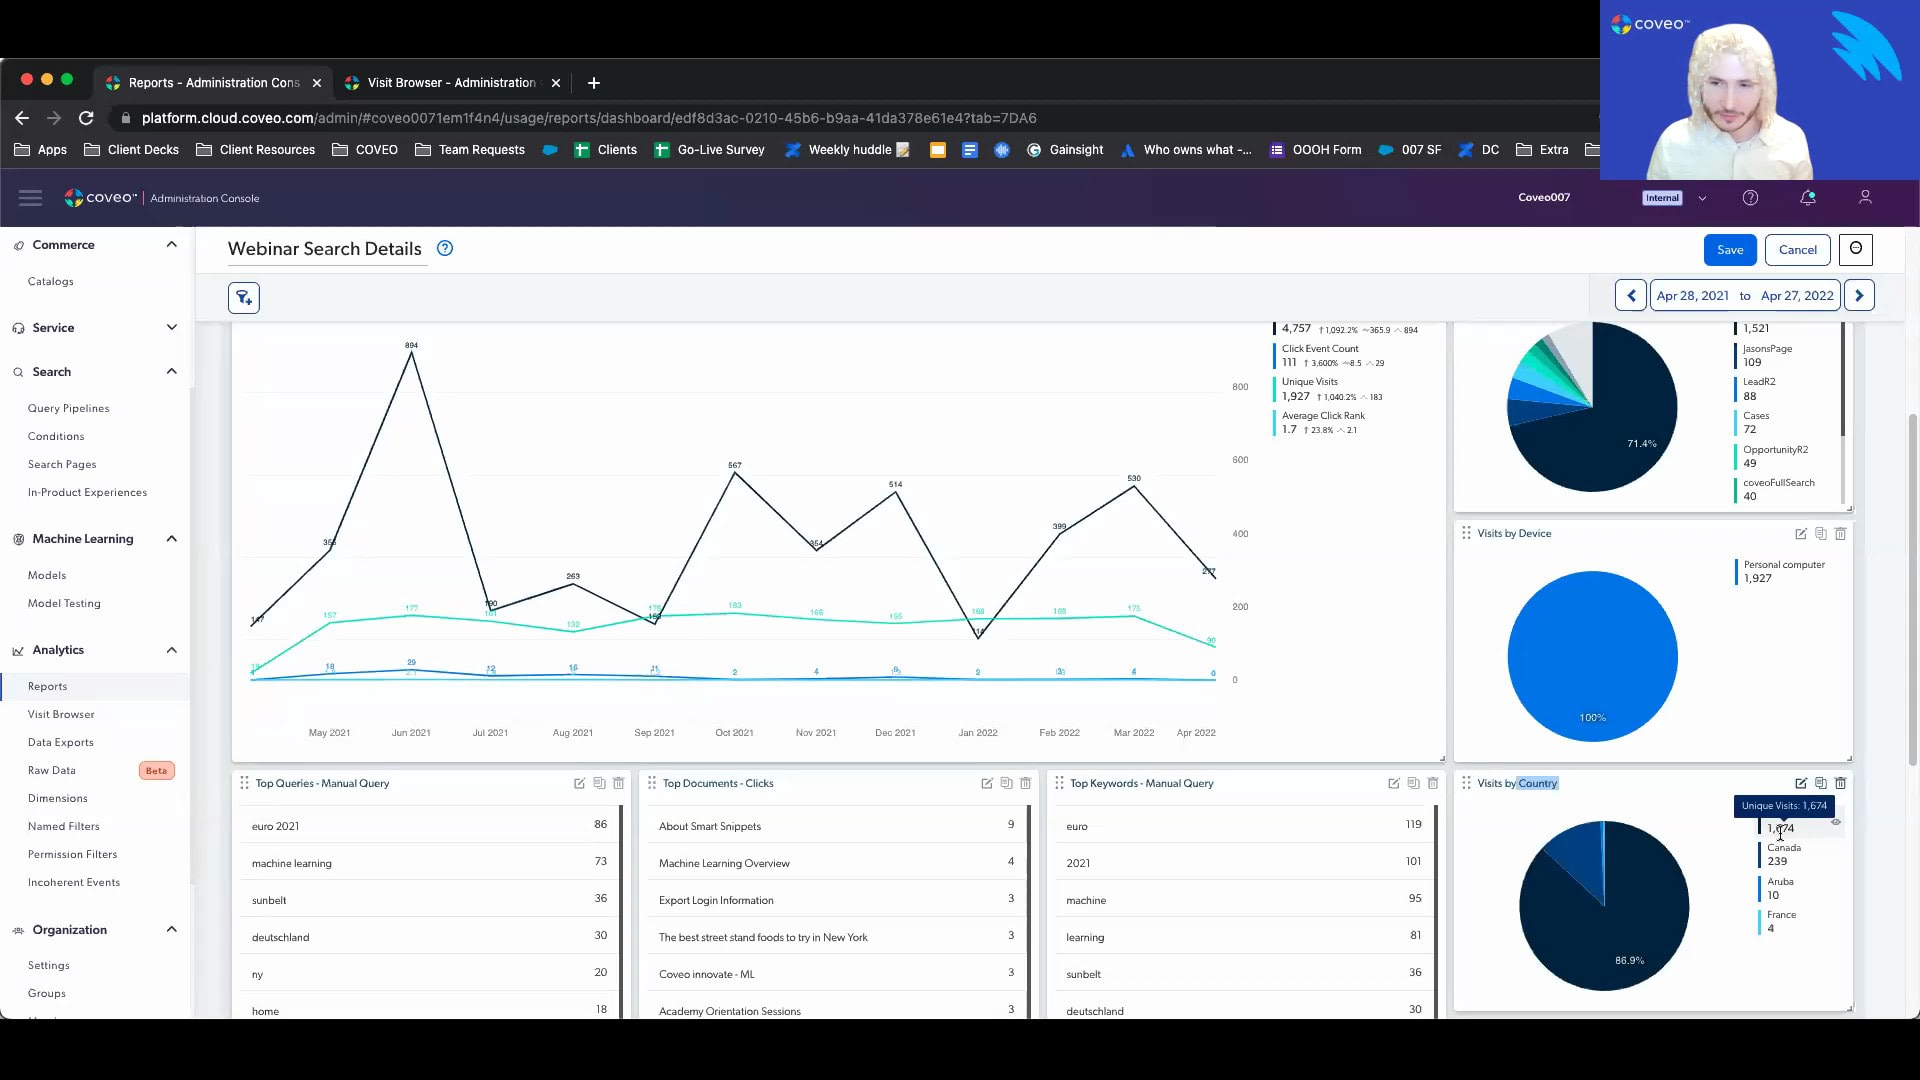
Just get a give it a few more seconds to let people join. Okay. We'll get started. So hello, everyone, and welcome to this month's learning series webinar. My name is Jasmine Oraz, and I work on the marketing team here at Coveo. So for anyone who is attending a learning series webinar for the first time, this is a monthly webinar program where we get more hands on with how to enable Cobio's features that can help you to create more relevant experiences. For this session, this is the first of our three part series on understanding usage analytics. And today, we'll focus on, the relationship between dimension metrics, explore some of Kaveo's out of the box reporting, and also touching on measuring your KPIs. So before we get started, I have a few housekeeping items to cover quickly. For this webinar, as usual, we always encourage you to, type your questions using either the q and a box or the chat box, in the right hand panel on your screen as we go along. Our experts here with us today will be answering some questions at the end of the session, so get those ready. And, also, as usual, today's session is being recorded. So, you can expect to receive the recording, following the presentation within the next couple of days. So today, I'd like to welcome back our speakers. We have Jesse with us, our customer one of our customer onboarding specialists, and Jason, our director of customer onboarding. So without further ado, I will pass it off to Jason to get us started. Thanks a lot, Jasmine, and hi, everybody. Happy to present here today with Jesse. So Jesse and I, as, Jasmine has mentioned, both kinda manage, new customer onboarding. So if you're a newer customer with Coveo, you may have interacted with one of us. I see, Conrad from Auth0 is here. Hey. How you doing out there? So happy to have you onboard. Today, we're gonna talk to you about usage analytics one zero one. By the way, Jesse and I also happen to both be musicians, so that's why I picked a couple of, action shots there. If you're if you're interested in jamming that with the Coveo crew, we're here with you. So let's talk about the objectives of today's sessions. So, we're gonna go through basic concepts of analytics. So we'll talk a little bit about the types of analytics that are tracked through Coveo, and we're gonna talk a little bit about data collection mechanisms as well. So there are a couple of different ways that you can actually collect data to be expressed in Coveo and a few different ways that you can pull data out of Coveo. So we will, examine this. We'll talk about dimensions and metrics. And then I'm gonna turn things over to Jesse later on, and he's going to do a full demo of us for for you guys to walk us through the visit browser and some of the the reports that we have available to you. And, of course, as Jasmine mentioned, we're here to take questions as well. So if you have questions that come up along the way, don't be shy. So let's dig right in. First and foremost, public service announcement that usage analytics are not just about reports. In fact, if you've purchased Coveo and all of you here are Coveo customers, you know that we are really all about AI and machine learning. And analytics is actually the raw material that powers all of our machine learning models. You cannot have machine learning from Coveo if you don't have analytics, at least for some of these models. So, what I'm showing you here is that different models require different types of analytics. So for automatic relevance tuning, this is that model that will promote popular content towards the top of your list as it is, you know, as people are clicking on them. This requires a few things. So one search is you have to be able to track what people are searching for. You also have to be able to track what is being clicked on. That's how you create that full spectrum, of learning. And then there's a concept called context, which you may be familiar with. What context does is it adds subdivisions into that. So I may be someone who's searching for a particular topic and answer it and and clicking on this. But, you know, you may be somebody totally different, and you have different needs and so forth. And that's context. And that means that depending on that context, the boost of results may be different. All of this gets tracked in analytics. We also have a machine learning model called query suggestions. This is when you start to type something in the search box, you'll see results display. Again, it requires searching, and it requires clicking. So you will never see suggested queries that weren't successful. And in Coveo's machine learning world, we attribute success to clicking on our results. So you the only suggestions you're gonna see are those that are kinda corresponding correspond to queries that have led to clicks in the past. Dynamic navigation experience. This is a model that will help rearrange some of the facets you may have on your page. It'll apply it it'll apply automatic filtering based on your query and so forth. So for this, you would actually need to track search events. You need to track click events, and there should be another bullet point here, but it's actually also the advanced query expression, which is what facet was selected or what, user controls were initiated when that, object was clicked on. And finally, we have a recommendations machine learning model. So it's could be content recommendations. It could be in a in a commerce perspective. It could be product recommendations. This is driven by page views. So it requires that we track every page that someone viewed, as well as what was what was been clicked on. So that way we can kinda say with this model, people who looked at this also looked at this. You have to have analytics in order to be able to power these models, and that's really the main point of this and why it's this is so important to think through. Now let's dig into some of the basic analytic concepts. So let's talk about event types. So there are multiple event types, that you're gonna be able to work with. So I've got them listed out here, search events, click events, custom events, and view events. And we'll look into the some of this event metadata in a minute. But one of the important metadata values that we're going to examine are the causes of these events. So depending on what caused the event, you're gonna see different tracking and different ways to view this. So search events could be caused by a variety of things. So, essentially, a search event is, like, gonna happen whenever your results page reloads. This could mean that it came from an interface load. Simply opening up the search page will cause an event, search event to be thrown. If you are searching, search from link means that I was on my global search box and I maybe or my my home page and maybe I have a global search box at the top. If I do a search in there and hit submit, it's gonna take me over to the Coveo search page, And that's why it's called search from link because it's actually a redirect. Whereas search box submit, a little bit different. I'm already on the search page. I have my results here, my search box on top, and I do another search up there. That's, how you would differentiate those two experiences. We also on the previous slide, I mentioned those query suggestions model. So we have a specific search cause that will let you know if query suggestions was actually checked, and that's called omnibox analytics. So if you see omnibox from link, it means query suggestions were used from the global search box. If you see omnibox analytics, it means that you were on the search page and you clicked on one of the suggested queries and so forth. So there's lots of different search causes. Same thing with clicks. There's different types of click causes, although they're a bit more, standard. So you've got document open. Simply, I opened up a document. If you have a quick view feature, if you just do a quick view, that also counts as a click. And finally, if you're, like, in, say, agent insight panel and you're attaching a document to a case, that attached the case is a click event. Click events are really critical in terms of driving that that machine learning value. So between the search and the click, that's what causes that that entire, ring of learning. Then we have custom events. So custom events are really more useful in reporting, and they don't really have as as much, pertinence in terms of machine learning. So things like if you execute a pipeline trigger rule that pops up a little pop up or something like this, you'll see an event that lets you know that that happened. If you go from, like, page one of the results to page two of the results, you'll see something like page or next. If you have got, like, a continuous scroll, but when you get to the bottom of the page, it reloads more results. You'll have an event that lets you know whenever that happened. And there's a lot of custom events that are used in, like, the context of commerce, like add to cart, view a detail page, remove from cart, and so forth. As well as if you are on a case creation page, we can track things like a case was submitted or we hit the case cancel button and so forth. So, really, the last bullet on here says anything. So any kind of, like, physical interaction an end user can have with your Coveo search interface with your website at large, we can send a custom event to track this. And then finally, there are view events. So view events are sort of that key factor for any anything commerce, you must have view events. If you're using recommendations, you must have view events, and it just tracks what every, page you view as they come up. So let's talk a little bit about the different event packages for different use cases. So if you have, like, a website search, a community search, or or even, like, an in product experience, this is basically like a a very simple search search interface. You've got your search box. You have your search results. You may have some facets over on the left hand side to give people the option to filter through things or some tabs on the top. For a simple search interface like this, anyone can build it using, like, the Coveo out of the box hosted search pages. And by default, you will get search events, click events, and custom events as part of the events package that's gonna drive that that solution. Of course, with custom events, you you can always add in, you know, additional, tracking mechanisms. If you are in the service use case, so you have maybe a case creation page as well as an agent insight panel. I've kinda grouped them in here as one because it's really great if you have one of those experiences. If you have the other, they kinda feed each other really nicely. But you will have some basic events, around case creation. So whenever a case is created, you can see a case submit event. If you do have a cancel button built, you'll see case cancel. And anytime you are updating the case form by putting in, like, a longer description, adding in additional field values, this is called context change. And a context change simply means that you're adding more value, more information into the experience that Coveo machine learning and our APIs are learning from and providing better information and refining as you are typing in. If you have a agent insight panel, so maybe you Barca a a contact center and you have Covey or like a like a Salesforce service cloud with Covey implemented in there. We talked a little bit earlier about the case attached. So you can have a a case attach event whenever you attach something. You can get an event when you detach that, and also context change again. So if you're adding different fields, if you're editing the description of the case, anytime you are editing any of the values that that help drive relevance, you're gonna see that shown as context change. And then on the commerce side, there's a whole science around commerce analytics. So we're gonna get the into that in the later sessions in this series. But with commerce, you certainly wanna have a detailed view, so it means you're looking at a product detail page. Add to cart is a really important one. Remove from cart as well. Adding a bookmark, quantity change could be something that's in there if you're adding additional quantities of an element that's in your cart. And then when you check out, you wanna have an event for that that helps track whenever a a checkout has happened. And then Jesse's gonna dig into some of this when we do the demo. But I wanted to share for you now just a little bit about what some of that event metadata looks like. So we were talking about these events. What I'm showing here, these are kinda like the event causes, basically. So what is the action cause associated with it? But there's a lot more detail that you send along with an event on a regular basis. So on this slide, I have an example of an event, as well as kind of a key to show you, initially, the difference between a dimension and the associated value. So a dimension is essentially that metadata that gets associated in to an event, and the value is basically, you know, the corresponding key to that dimension. So if I look at this, it looks a little bit, tricky to to get your head around at first. But if you see anything you see here in purple, these are considered dimensions. So you can actually create reports in Coveo based on any of these purple dimensions. And then what you'll see in, red or blue, these are actually the associated values. So as I look at this event, I can see the action cause. Search box submit. That means that this was a search event. So I I actually typed something into the search box, and I hit submit. If I look down below, I can see query text machine learning. So that's what I searched for. I searched for the words machine learning. You can see what query pipeline I'm using here. You can see some things around origins. So origin level one, that is the hub that I'm on. The search hub, in this case, is called Jason's page. Origin level two is the tab that I'm on. So you might have on your interface, like, an all tab and then maybe, like, a knowledge tab or, you know, maybe a products tab and a and a support tab or something like this depending on your implementation. You'll see that listed in origin level two. Origin level three, I'm on a hosted search page, so you don't see it here, but that is basically your referrer URL. So you'll be able to see where the user came in from when they landed on your page and a whole lot of other information. You can see what kind of browser I'm using and so forth in here. So that gives you an idea of some of the some of the metadata you can work with. Gonna pause here. I did see that there was a question, in the q and a. This one comes from PK. How how can we access these events from an analytics tools like Tableau? Are we able to connect to the underlying data source storing these Coveo events? And the answer is absolutely yes, PK. While talking about it right now, basically, with every Cove implementation, you have access to a Snowflake reader account. So all of our data analytics in the back end is stored in Snowflake. And, with your Snowflake reader account, you could write and and implement, like, SQL queries, pull that data directly out of Snowflake, and then put it into any b l BI tool like Tableau that you wanna use. If you have your own instance of Snowflake, you you can actually, we do an event sharing process. You can work with us on that, and we can actually send our Coveo events directly into your Snowflake implementation so you can get it out of there. The old fashioned way is from the visit browser, of course. You can certainly download the raw data from all the visit content into a CSV flat file and then import that into something like Tableau as well. So we give you a lot of different options for data visualization. Okay. So let's talk about the data collection mechanisms really quickly. There's a few here, and I would say ninety five percent of our customers, especially if you've been a customer for Coveo, for over a year now, you're gonna be on the, the option on the far left, which is the Coveo analytics component. So this is what comes out of the box when you implement with Coveo JavaScript UI framework. It is, like I said, it's out of the box event type. So depending on the package, if you have Coveo for Salesforce communities or Coveo for service cloud, when you implement that with JS UI, you're going to get out of the box things like case submit, case attach, and everything. It just kinda comes as part of the package. And that's the nice thing about Coveo Analytics. It is a package. It doesn't require a lot of manual configuration, but you can manually configure it. You do have the option to go in and code in custom events, add in your own events into that analytics, component. But it's simply a JS UI component that comes out of the box with the Coveo JavaScript framework. The next option here is your collect endpoint. So, if you have a Coveo for commerce implementation, chances are you are using the collect endpoint. If you happen to have the Coveo case assist feature on, like, your case creation page, then you're also using the collect endpoint for this. So it is not JS UI dependent. That's the good thing. So, you can basically implement collect on a headless framework solution, and you can build this out if you're building it with only APIs. So you have a lot more flexibility with the collect endpoint. It's also a lot more robust. And so generally speaking, when people use collect, they'll sync it up with their Google Tag Manager or their Tealium data layer. And so that the data that goes to Coveo through this collect endpoint is similar to the data that you're already collecting in in your data layer. So, yes, it's used mostly in in commerce now, but this is sort of the way of the future for Coveo as we roll out more and more, headless components and different mechanisms of of being more flexible with customers. You're gonna see the collect endpoint as a lightweight option to collect really robust analytics. And then finally, there is the our queue protocol. So if you are a QBit customer, QBit is now part of Coveo, and QBit customers, or QBit implementations use their own collection protocol called Q protocol. And it's similar to the collect endpoint. It's very robust. So with QBit customers are always in the world of commerce. So there's a lot of different, like, placements and so forth on your site. So it's a lot of robust analytics that need to be tracked, and that that protocol does that for you. So you won't have to really know this stuff too much. You should kinda know depending on your implementation of what what, protocol you're using to collect events. And your CSM can definitely point you in the right direction if you have any questions about that. But each one requires a little bit of a different approach if you want to edit any of the events that are being tracked. And then one final section before I turn things over to Jesse is gonna be around dimensions versus metrics. So I showed you a little earlier that kinda comparison. But, basically, at the end of the day, a dimension is an analytics event, with metadata. And it has things like facets, title, like search hub. You saw browser was one of the options. You know, what tab am I on and so forth. And these can be used in reports to provide that baseline contact contextual information. And then metrics are more like the numerical values that are associated with those. So, for example, you'll see things like click count. That'll show you how many clicks happened, and then you can pair that to my search hub. So if your dimension is search hub and your metric is click count, you're gonna be able to see how many clicks happened on that search hub within a given period of time. And so you can leverage this combination of dimensions and and metrics to create pretty nice reports with Coveo's out of the box reporting platform that is built into our org. You'll have some flexibility to basically build any type of report you want to, and Jesse will probably give you a little bit of about this. So when I'm talking about dimensions, you know, each dimension represents a single element of that visitor's context. So I showed you that big long screenshot before of all the different dimensions that are in there. It's, quite a bit of them. They can also be used to create filters that customize information. So when you're building out, you know, your reports, you can filter on all those dimensions as well, and they're available through the COVID COVID admin console. In terms of metrics, now these are indicators that are calculated through analytic events. They're compiled from the values associated with dimensions, and they give you a sense of the interactions between visitors and your search interface. We do have some common metrics that kinda come out of the box for evaluating success. So for example, query click through, what this looks like, it looks at every query or search event that was sent, and then what was the corresponding click. Is there a corresponding click? And it shows you that ratio of how many queries result in a click. Because ultimately, as I mentioned at the very beginning of this, that click represents success in the world of Coveo. We can look at average click rank, which shows you when a document was clicked on, where was it on the page. So if it was the top result that was clicked on, then your click rank is gonna be one. If it was the third one down on the list, your click rank will be three. And so the lower that click rank is, the better. That just means that the the content that's being interacted with is right within eyeshot of, the end user. Visit click through is similar to query click through, except instead of using the individual query as a denominator of that equation, we're using the entire visit. So we're saying throughout the entire time that this customer was on the website interacting, did they click on something, or did they leave empty handed? That's not a good experience, so you definitely wanna see higher visit click through. We can track content gaps, which simply uses the dimension that's called, has results. And so that dimension basically means, like, did the query have results or not? And if, you know, obviously, we wanna try to remove as much as possible the no result queries because if you have a query with no results, then you're not gonna have any query click through for that. It's not gonna be a good experience for your for your end users. So you can use a content gap report to kinda identify where those content gaps are and address them. You can use things like counts. I already mentioned click count as a thing. You can look at custom event count, search event count, unique ID count, unique visit count. This is just gonna give you nice, you know, basic, I I I would say, traffic based analytics for what's happening on your site. And then you can use trends as well. So any of the things we talked about already, you can build a trend card with, which will show you things like which queries are trending up over time. What are my top trending documents right now? So these things are all available. And I just have a one last screenshot here around it, which kinda shows an example of how you can build a a card in, you know, the the analytics platform. So in this case, I'm choosing a dimension. The dimension that I chose was, the page hub, origin one, and then I chose the metric of search event count. And then I call this searches by hub, and you can see I chose a pie chart to express this. So now what I get is a pie chart that shows me a breakdown of all of the different searches that happened within each of these hubs and then kind of a percentage, so where where are my searches coming from most. So so that's it for the static content. Now to talk to you about the more exciting stuff, I'll hand things over to Jesse who's gonna do a a demo. Perfect. Thank you for that, Jason. So let's go ahead and get started. Now, what I've gone ahead and done is I'm within the reports details. I'm in a test org, so please take these numbers with a grain of salt. I'll just move my microphone a bit closer so you can hear me better. So, I'll be frank. There's a lot to unpack. So what I'm gonna do is I'm gonna keep this as focused to the things that would be the most valuable so that there's no essentially excessive information. But you can see that I'm on a search details report or, as of right now, titled webinar search details report. This is a custom report that's really meant as a one stop shop. So it's a great way to get a bird's eye view of everything that's happening for your search performance. You can always either speak to your onboarding manager or your customer success manager who should be able to help you with this report if you do not yet have it. So right off the bat, you can see that we have metrics, we have dimensions, we have different cards, but I'm just going to take a minute to say always be mindful first and foremost of the date and what kind of date you're looking at, as well as if there might be any filters. Now anytime that the numbers might not show, you know, before panicking, the date or any filters that might have been imposed could be the cause for that. So, as you can see, we're looking at the last year of data. We don't have any filters on. Now let's go ahead and take a look. So right off the bat, you can see that we have tabs, sections, and we have cards. So let's take a look at a couple of these and let's just say, so looking at these actual cards themselves, if we want to understand what's going on, how any of this was done or add to it, you can actually see by clicking on edit. And from there, it'll bring you into more of a kind of construction mode. So right off the bat, everything is done with cards. Now these are what cards look like. There's a lot of different kinds of cards, just to show you. You also have explanations for them if you wanna play around. But this is an out of the box report. The whole purpose is to save you the hassle. So let's go ahead and get into some of the already built out cards. So here, for example, you have a metric time series card. So here are those metrics that Jason was just talking about, and it's as simple as seeing all of these metrics over time. Now what's nice is if you wanted to, say, remove something or if you wanted to maybe add something, for example, average click rank and let's see our average click rank over time. It'll go ahead and it'll essentially do this in real time so here's that average click rank, You know, let's hope that that's going down, as well as our traffic. A little bit further, you can see it right here. Here are some of the pie chart cards that we were talking about. So this is a great way to get a visual cue, on some of your performance. And just like how we were talking about dimensions versus metrics, here you have metrics. So real numerical things, search event count, click event count. Here you have more qualitative things. For example, the which search hub or what kind of device or what kind of country. So the kind of country, for example, the United States or Canada isn't necessarily something quantitative, but the amount of visits is quantitative. So we can think of dimensions as qualitative and the metrics are what show the volume of these dimensions. Just a few more things here, you have top queries, top documents, top keywords, take it with what you will. Again, again, this is more of just kind of a summary, a bird's eye view. Let me just go ahead and hit save so we can get out of the editor view. Now moving along to the health check tab. So we have what we call the Coveo big four. We had spoken about some of them, but looking at, for example, visit click through, query click through, average click rank. So for every visit, within the visit, did we have one successful click? You can have a visit that's open for an hour. You can search thirty times. As long as there's one click, it'll count positively towards this metric. Query click through for every query, did we have a click? So this really answers the relevancy question. You know, for every time that somebody asks for something and queried something, were we able to give them a personalized experience? Were we able to give them a relevant answer? Visit click through and, an issue with this metric might speak to a lack of engagement. So maybe facets, tabs, the way that the components on a website are, laid out and how somebody's interacting. Where a low query click through might just speak to a relevancy issue. It just means that we're not providing, what people are looking for. You know? And out of maybe an index of ten, twenty, fifty thousand items, that can definitely be a hard experience, which is really where our machine learning models come in as kind of the bread and butter and really the engine under the hood that's constantly working to provide more relevant experiences by the day. Of course, this is a test organization, so take the numbers with a grain of salt. Otherwise, I may be having a panic attack over them. But here you have, so, average click rank as well and then finally content gap. So for content gap, actually, rather than speaking too much about it here, I'll jump right into the, tab itself. But, really, this would just be anytime that somebody searches, and we actually don't have any results. It's the classic no results found. We'd constitute that as the worst search experience, so we'll always try and keep that underneath five percent. And you can see right here a couple of benchmarks. Those might vary based on your industry, based on your use case, but this is generally what we're trying to aim for. One final thing, you'll notice here that, you know, this has nothing to do with numbers. It's all written. What gives? We're in a report. So this is a note card. If I were to click edit, you could open it up and it's a great way to communicate things, maybe something important that happens or some layout of the report, you know, make sure you do not touch, component x. Otherwise, it'll mess the entire report up. So a good way to actually be able to communicate to colleagues. And we even have another report template called welcome to Coveo Analytics. It's honestly a lot of note cards because it explains, by the time that you get through this report, you understand reports and you understand how to use them. So let's just say you have a new team that's going to be taking on analytics. We're working with, new people that are now going to be overseeing that. It's a great way to, get up to speed with how our reporting system works. Again, feel free to contact your onboarding manager or CSM for that information. Now this is where we're gonna go ahead and put our detective hat on because this is where, we're gonna be able to look at essentially every ask or every question that one of our end users, so clients, support agents, you know, our internal employees that they've asked that they weren't able to get an answer to. So this is a great tool because it really shows us where we might be lacking, where we don't have the answers to what people are asking. So we're in the content gap section of the report and right off the bat, you can see our content gap. In this case, it would be two thirty four over one thirteen forty six because this is the total query count and here we would have the breakdown based on different tabs. But this is where I really want to focus. So this is showing each query without a result. Really powerful because you can see where people might be going wrong. The whole premise here and why I mentioned that we're going to put on our detective hat is that this falls into the process of relevance tuning and it's not quite, cookie cutter. It's really about diagnosing and understanding what people are searching for that they're not getting answers to. To put this into perspective, let's just take, for example, like, this query here n y. You know, I'm I'm not certain, but I can bet my money that people are searching for New York, but we might not have keywords that are centered around n y because it's an acronym. So from there, we could go ahead and add, a rule in which if you were to go ahead and type in NY, it would also submit another query which would include New York. We have the keywords for New York, so the right documentation would appear. Somebody would click on it. And in that, Blingo and I, we would essentially mitigate content gap for that query. Now I could spend an entire, other two webinars just on that process and on the rules that we can add. We have done some other series where we get into relevance tuning, give a couple of real examples, as well as go over query pipeline rules, which is where you would make those adjustments. So definitely recommend that you go check them out. That would be getting started with search performance. Now a couple of things to keep in mind when it comes to content gap. First off, not every content gap is exactly as it seems. In fact, we have what we call a false content gap. And what this means, it can mean a few things. So let's just say that somebody had, gone ahead and they were they had selected the marketing assets tab. So when they were on the Coveo search page, they had either a tab selected or a facet selected. So a facet or a tab are essentially filters. You know, maybe you only want to see content associated to last year or content from PDFs and nothing else. So we're filtering out information. So if I were to search for something with one of these filters, if we were to have, results for it, but the facet was selected, that would be a content gap because we still wouldn't see. So we have the material, we have essentially the answer, but there was a filter at play that kept us from, from the user seeing the result. Hence, you have your false content gap. So, that's why we've gone ahead and added this detail section where you can actually see if there was a tab that was selected. One other thing to keep in mind is that when you have content gaps so let's take this query right here, for example, sunbekt. So, you know, the k letter is right next to l, so I'm willing to bet honestly a thousand bucks that they were trying to write sunbelt. Now something like this machine learning will learn over time, and it's constantly adapting to people to understand those nuances. In this respect, this could be a content gap today, but might not be, sorry, could have been a content gap in the past, but isn't a content gap today. So it's always important to essentially go and try this out on your search page to see if it's still a content gap. So here you could see that for the query, it was on the all tab. So there's no filter here. This is look giving you all the information. So we know that that's not a factor. So we can go onto the search page, type in, this specifically and see if we get results and see if essentially machine learning has figured it out yet or not. So a couple of things to keep in mind on that front. And the last thing that I want to speak about when it comes to content gap is given your use case, adding a rule might not always be the way that we can troubleshoot relevance. In fact, let's just say that you're, a community, you know, you're working in self-service. You're trying to help people and enable them with knowledge articles, with how to videos to prevent them from opening up a case. So in that case, by enabling them and looking through this content gap report, you might realize that there are things that they're searching for that we might not even have content built around. Maybe a new product and a specific question that's come around that product and we don't yet have a how to article that would enable them, that would give them the answer, and that would keep them from opening a case. So in that case, this can actually act as a magnifying glass into where your clients or your end users are falling short and not getting the answers, which therein we want to go ahead and create new content to make sure that they're supported. So really powerful tool. Let's move along from content gap over to query performance because let's just say we have the answers that, you know, we had no results for but what about everything in between? What about something that we had an answer for, but it's result number sixty four and you would have to, you know, dig and dig to actually get there? Like, nobody wants to go to page seven to find the result. Right? So this is where we have the query performance tab. Within this tab, it gives you a couple of metrics but let's just focus right here on queries with low relevance. Now there's honestly a lot of factors that go into the relevance index, which I'm not gonna get into, but it's essentially just a number between zero and one. One would indicate perfect relevancy. Zero would indicate, you know, awful relevancy. Now what's really nice here is you can see that for the things that have been searched maybe one time, is it worth it? Honestly, it's probably not worth it because it's only been searched for one time. Machine learning, might eventually learn or is is is aiming to eventually learn to correct this. And the more rules that we add to try and mitigate this, the more that we get in the way of machine learning. What I can, however, go ahead and do is I can click on this arrow right here and by doing that it's now gonna show me what's been searched for over a hundred times and from there we can suss out what has a low relevance index. So if I were doing relevance tuning and I were trying to understand, what needs to be remedied or actioned immediately, this is what I would do. I would focus on these that have been searched for multiple times. I would look at what the query is. I would test it out. I would also ask, it's really important to ask even just from kind of a, if you will, for however you may use the term, kind of like a consumer psychology perspective as to when somebody is searching, who's your audience, what's important, and when they were searching for Sunbelt or they were searching for Euro twenty twenty one or machine learning or whatever it might be, putting yourself in their shoes, what were they most likely looking for? From there, we're aiming to come to the conclusion of I now know what result or what rule I wanna add so that we can make sure that when they search for a, they're getting b because I know that b must be what they're looking for, which is where they're falling short. Now, let's head over to this final tab. There's, honestly a lot of tabs that you can get into. Again, it's already, a lot of information, and there's a lot to unpack, so I really want to make sure that this is as, bang for buck and really value packed for you. So looking at the machine learning tab, now, you know, Coveo being a relevance company, being an AI or machine learning company that tends to have a really complex, a really complex kind of association. Here is where we can actually see what kind of an impact machine learning is making and it's really not as complicated as it should be or Coveo at least enables it so that you don't need to worry about how complex it might be. Using this tab right here, you can essentially see what percent of visits have a click with ART. Now let me explain. ART is one of our primary, machine learning models. Jason had gone ahead and mentioned it prior, but this would essentially be automatic relevance tuning. So I'm talking about the manual process of relevance tuning, you know, diagnosing and adding rules. This thing is actually just doing it, you know, while we sleep. For as long as the model is set up, it's going to begin to learn from queries and you can better believe that over time it's going to get way more effective than you and I at understanding how to deliver relevant personalized experiences. So this is where you can track its progress and the thinking here is that over time, you should and almost always will see this increase. This is because the more queries that you have, the more it has to learn from, the more associations that it creates, and this thing never forgets. It learns from every single click so that it can make sure that the next one, is done with more ease. Finally, you can also just see, little extra tidbit of information, but the actual click rank based on something that was suggested by automatic the ART model. So when somebody clicked on something that was suggested by ART, was it the fifth result? Was it the, first result? Again, these are test data, but it's cool to see that this is more or less just one all the time, which means that it was the first thing that was suggested. If you go to the Coveo community, this is where you can see, we've we've, know, it's consumed thousands of queries and you can see essentially all of our machine learning models at play in a really easy, kind of, digestible way. So with this out of the way, this is what I wanted to cover for the report itself. Now just before we wrap up and go into the final q and a section, I just wanna cover two other key features. I'm gonna go ahead and start with the visit browser. Now I wanted to keep the date intact, but just in case, to make it a little bit more clear, you can find it right here under the analytics section. Now on the visit browser so this is a great tool because as you can see, this is every single visit that somebody had taken within this date frame. So what does this mean? This would essentially mean that you can not only get information on each visit and that applies to if they're authenticated or not, but you can even go a step further. So let me explain. You can see here some basic, information, how long the visit lasted, the username. So if they were unauthenticated, then you wouldn't see something here. This is internal so, of course, it's all authenticated. Location, browser. Now you can see the event count. This is essentially how many actions were taken per visit. And if I go ahead and click on this, it'll actually show us each event. Let me go ahead and actually choose one that, say, has thirteen events. So right here, you can see each and every event that was taken during this visit. And let's go even further. You can go ahead and click on an event to get all the metadata. So here's that metadata that Jason was talking about, and you can essentially get this. So everything from the tab, to the actual search hub that they were on. So needless to say, it's a great diagnostic tool in terms of what people are doing and how people are interacting on a Cabello powered search page. But where it gets interesting is you can go ahead and add filters. So, for example, we were talking about content gap. We're talking about, what queries lead to content gap. So if I were to add the filter, has results is false. So when somebody searches, there's no results to display whatsoever. Let's just give this a quick second to load. Right. So when they search, there's no, results whatsoever. So, I e, you have a breakdown of each and every visit that had a content gap in this date frame. Now this is going back an entire year. But then not only that, but you can do the exact same thing of breaking down all of the different events, and you can try and pick up so this is essentially looking at a breadcrumb trail of what people had done when they had a bad search experience, when they had a content gap search. Now again, it does involve kind of on the ground, trying to understand where they went wrong, trying to it's you don't always get, like, the most actionable, insights from it. It can be hit or miss just because you really need to understand, what pieces of information might give you context and if there's enough to understand what kind of a rule that you might want to add. But needless to say, you're actually able to see every step and essentially see that user journey in real time for every single search that might not have had any results whatsoever. The last thing, that I'll cover here and I'll just go ahead and hit these quickly is looking at the dimensions. So Jason had mentioned that we have, both regular dimensions, or out of the box dimensions as well as custom dimensions. So with this, the only point that I wanna make here is if we want to be able to, learn from dimensions from custom dimensions, if we wanna be able to filter from them, and essentially report on them, we'll have to make sure that it's been added here. So it's as simple as that. But once it's gone ahead and added, you go ahead and you can just pull that in from your system. It'll pop up here and then you can use it within the report. And last but not least, going back to the question that we had around integrating with other analytic systems, specifically there was Snowflake as well as Tableau. So that can be done within this tab. This may this is listed as a beta because we're on the test, so this may actually be in the data exports tab, but it will look the same nonetheless. So right off the bat, first off, I'll actually yeah, I'll just cover here. So in terms of Snowflake access and then, you know, connecting with something like Tableau, this is where it would be done. And then furthermore, looking at data exports, so this is where, as Jason was mentioning, you can download the raw data and then do with it what you will. So for example, it's really as simple as going into creating a CSV export. You have your date frame. You can go ahead and add any filters. So maybe you have a search hub specifically for one, type of demographic and you want to download information specifically for them. Maybe for last quarter, you go ahead and plug in the dates. Finally, you can also filter dimensions. If there's, you know, dimensions that are fluff or maybe not as important, you can just take them off. You'd go ahead and add the data export, and within moments, it would pop up here, which you could then go ahead and download this. You can go ahead and create, for example, a weekly schedule or maybe a a a monthly schedule, which you could then go ahead and pick up from there. A really common question is can this be sent out, via email automatically? Unfortunately, it can't, but at least you can wake up, you know, go to your reports tab and this will already be waiting for you with no additional action needed. So, a lot of information right off the bat, but from an analytics perspective, this really is kind of looking at everything from a bird's eye view. From an introductory standpoint, this is a great foundation to understand your reports and to understand how you can start to go about driving your search performance up positively, as well as some of the features that kind of surround that process. So I'll stop sharing from here, and we can go off. I know we're almost out of time, but we can head right over to if there are any additional questions before we touch off. Thanks a lot, Jesse. Please, if you do have questions, feel free to send them up in q and a or in chat. One some of the questions that I saw earlier were just kind of around like, it was a really good question around, like, if I wanna dig in deeper, where do I go and what do I do? And so it's a good opportunity to kinda share a little bit about some of our online resources. So if you're not familiar with our Connect community, I would suggest familiarizing yourself soon. It's just connect dot coveo dot com. And in this community, you've got this is where you would go to support. If you have any cases that you wanna create or something like this, you can come up with ideas here, and you can actually interact with Coveo r and d professionals. But if you have questions, like, for example, usage analytics, I just searched for that. So it's fresh in my, like, query suggestions. There's lots of documentation you can drill into here. You can use our facets to kinda, like, break that stuff down. But anything that you find in here that might be interesting, like usage analytics events, this document drills into that pretty nicely. Also, from the community, you will have access to our our training platform level up as well. And, I can get to that right from here. If I go to level up, this is where you'll find all kinds of great courses. And so while you're here on level up, if you go under learn and hover over this, you'll see that there are some skill paths. You can, of course, use the search. So maybe you'll just say analytics is what you wanna look for. You can do your search here, and then you'll be able to access all of the analytics related courses or or there is, like, an entire skill path that is designed for this. If you go down in here, you will find it. And the skill paths have, like, multiple courses within them. So when you go to the usage analytics overview, you'll see the different courses that are included in that skill path. And if you're really new, by the way, there's also the concept of road maps in here. And if you go into road maps, we do have a new customer onboarding road map in here. And within that road map, you will find other skill paths. So, like, the overall solutions overview, analytics overview, relevance tuning, and machine learning. I can see that we have another question. Yes. So is there a way to block out employee IP addresses so when we filter out what we're what our own employees are searching for? Yeah. There is absolutely a way to do this. I can demo this for you really quick. So we have a dimension that's called is internal. And so that's the way you would do it. When you're on a report, you would just put is internal is false, and that would filter out all of your internal employee addresses. However, how do you do that? Like, how does it know what is internal and what is not internal? Well, there is a way to control this as well. In your org, as an org admin, if you go into the organization settings down here, under organization settings, analytics, you'll have a tab for that, and then you'll have this internal events. And so what you can do in here is plug in IP ranges for all of the known internal users. And whatever IP ranges you put in here, now when you add that dimension is internal is true, it'll show you only the content from those IPs. If you put is internal as false, it will filter them all out. So this is the way. And just to add a little it comes yeah. In the meantime, I'll just go ahead and add a little bit more context. Generally, the question of, you know, how can we slice and dice the information or I have this, like, niche way that I wanna be able to look at the information. Almost always, the answer will lie in some sort of filtering, and what's even good I'm gonna go ahead and, take over this share screen for screen share for just a minute. What's even great is just to try things out with the filters. Like I mentioned, as long as there's a dimension, whether it's custom or out of the box, then we can filter on it. So, for example, if I were to have that question, the first thing I would do is try, for example, user. You might have user ID. Or can we filter, you know, I wanna filter based on, like, country language or maybe, like, a specific demographic. And then we can think of, like, the specific factor that might be able to, by people that essentially give us that window that really specifically shows that. And the big Correct. Yeah. Go ahead. Oh, yeah. It's just that, honestly, you have massive capabilities with the filtering. So even if it's just looking through the dimensions, you might be surprised as to what you find that you can use to be able to look at that information in a more specific light. And my favorite thing to do with this is you can see on this report, there's a couple of pie charts over there on the right. So those pie charts have been pretty much anything that you could hover over and you'll notice that the the mouse changes, it's clickable. And so if you already have, like, a pie chart that's built on one of those dimensions, if you click on the piece of the pie that you wanna use to filter, you can see that it adds the filter to the top of the dashboard up there. So if you have certain elements that you like to filter on often, build a little pie chart for it, and you built your own facet essentially into Kovay Analytics. Yeah. Alright. Any last questions? Alright. I think that about wraps it up then. So thank you, everybody. Really, really appreciate your time, and it was a great, conversation. Thanks for all the questions. Just wanted to jump in here and say just before we sign off, like we said earlier, you guys can expect to receive the recording in the next couple of days, so look out for that. And I guess we'll also just plug our next session as well, coming on May twenty sixth, so you should get the invite for that as well. And if you have questions following this session or general questions, we do have our customer success office hours coming up next week, I believe, or in the next Right. And and then our next session. That's right, Jasmine. Our next session, we're actually gonna dig a little bit deeper into those custom dimensions as well. So if you wanna learn more about how to really customize your reports, the sec the second and third session are gonna get deeper into this. Sorry. Hey. That's perfect. Yep. Thanks, everybody. Alright. Thanks. Have a good one.

Understanding Usage Analytics: Part 1

