

In many companies, when justifying your customer experience (CX) technology investments to your CFO, cost-cutting KPIs are king.
Most benefits cited for the CX tech stack are usually around operational efficiencies including call-center deflection, problem resolution time, first-response time, cost-per-interaction — all actions which would enhance customer service representative (CSR) performance.
Lip service might be given to satisfaction, enhanced loyalty, and word of mouth (WOM) referrals — but rarely are these quantified into real dollars. As a result, managers in many companies are embarrassed to cite “enhanced satisfaction” such as Net Promoter Score (NPS) and loyalty because they are convinced that Finance will shrug.
Therefore, the impact of technology on the customer experience (CX) is usually missing.
In my experience, this is a costly mistake. CX benefits actually provide the biggest payoff for your CX stack.

Go Beyond Cost Savings
This article then provides fodder for all the CX leaders looking to finally quantify a job well done. If designed and implemented correctly, technology provides a bigger payoff through enhanced customer loyalty, margins, WOM, and engagement.
WOM is especially important in B2B as a majority of new customers are acquired this way.
Customer Care Measurement & Consulting’s (CCMC) new 2021 National Delight Study found that WOM from delighted customers has double the impact of WOM from satisfied customers, so investment in “delight” can have an even greater impact on customer acquisition. And what CFO doesn’t care about top-line profits?
Delight is about proactively engaging customers, whether with actions or communications, reducing their uncertainty, and anticipating their next needs. The key is that the communication must be relevant to the customer’s current situation.
I call this delivering psychic pizza — I ring your doorbell and say, “Here is the pizza you were about to order!” Amazon, Domino’s Pizza, and Intuit are examples.
Since technology is one of the largest investments around customer experience, I’m focused on technology’s impact on helping create delight. Delight can be created via anticipation and proactive communication as well as a flexible response based on intelligent analysis and empowerment.
My experience is that less than one-third of vendors understand the CX side of technology impact, which stems from proactivity, empowerment, decision support, feedback collection, and intelligent analysis.
Components of Business Case for Technology
Technology usually impacts CX and the top line in at least five discrete ways:
- Retain more customers by preventing problems that cause attrition
- Retain more customers by effectively handling problems and questions when they occur
- Enhance retention by moving customers from satisfied to delighted
- Surface problems when they occur so the service system can fix them
- Win new customers via enthusiastic referrals
The sum of the above benefits to both the top line and the bottom line are often 10 to 20 times greater than the total cost-savings a technology can deliver.
Therefore, if tech projects are evaluated primarily from the cost-savings perspective, fewer projects will be selected and, in many cases, the wrong projects will be selected.
Understand the Market Damage Model
There are eight data elements that are required to quantify these CX benefits. Many have been part of the Market Damage Model used by CCMC and its predecessor, TARP, for over 30 years.
Companies as diverse as American Express, Kraft Heinz, Phonak, 3M, J&J, IBM, HP, Toyota/Lexus, Chick-fil-A, Allstate, American Express, Coors, Qualcomm, and Salesforce have justified investment in service, which has led them to the top of their markets.
These eight data elements are:
- Customer loyalty with no problems vs. if encountering a problem – normally 10-20% difference
- Overall customer attrition rate – for most companies 5-20% per year
- Customer problem rate – 5-50% for consumers and 30-50% for business to business
- Customer complaint rate – 5-40% for consumers, 20-60% for B2B
- Problem resolution rate (dissatisfied, mollified, satisfied, delighted)
- Impact of problem resolution on loyalty and word of mouth
- Customers won via word of mouth from satisfied referrals
- Customers won via WOM from delighted referrals
The above data elements can be determined from a short survey of a random sample of customers. Two other numbers are important to quantify if the CFO is to be successfully engaged:
- Value of the customer – don’t use lifetime value (LTV). Use two years of revenue.
- Overall customer attrition rate – for most companies 5-20% per year.
Estimate Conservatively
First, the average value of a customer must be agreed upon. This number must be conservative. CFOs seldom accept LTV because it extends beyond the time horizon of many products and strategies. Most CFOs will accept two years of revenue.
Secondly, the overall customer attrition rate must be estimated. A general rule is half of all attrition is due to customer disappointment and problems. The value of this number of customers is a reasonable upper limit of the payoff of enhanced customer experience, excluding completely new product introductions/innovations.
Survey Questions
The data to construct the quantification models can be gathered via a survey of a random sample of customers.
Key questions to ask include:
- Have you encountered any problems,
- Which was the most serious problem,
- Did you complain,
- How was it resolved
- And what were your resulting market behaviors?
This survey works well with both B2C and B2B customers and, ideally, at least 1,000 responses should be received to assure statistical validity. As a fallback, work with your Insights Department to estimate the parameters.
Results can be portrayed in a chart like Figure 1. For this example, of 100,000 customers, 30% have a problem and only 40% complain. This problem rate is low for B2B, but the complaint rate is average for B2B customers. Assume that the two-year value of the customer is $10,000.
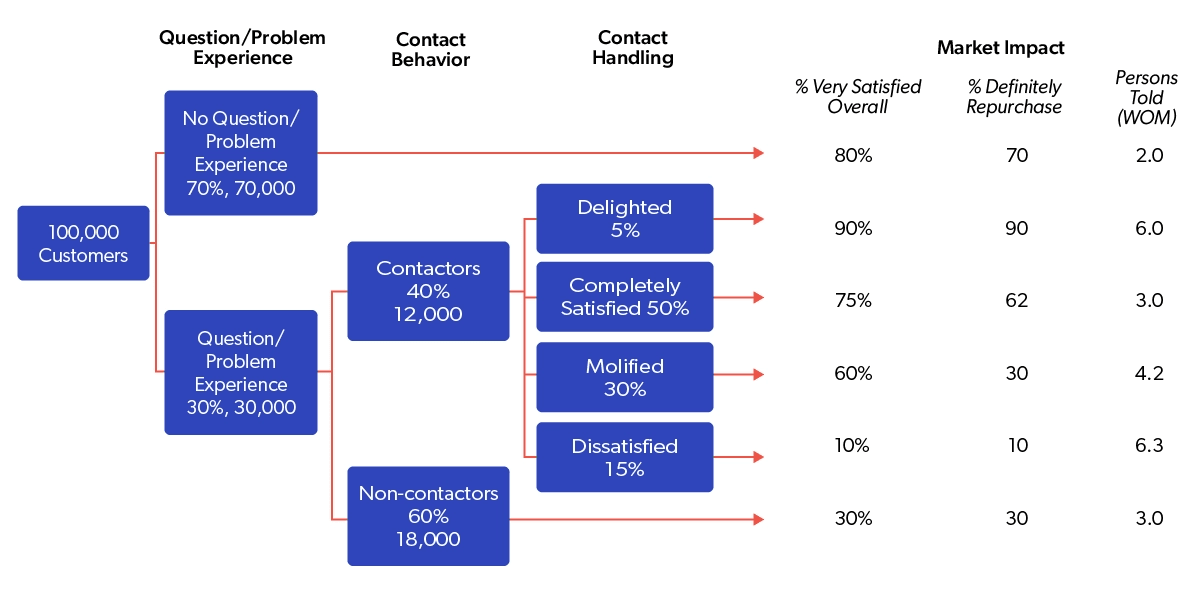
Once you quantify the number of customers with problems who complain — and those who don’t — along with their market actions for each possible outcome, you have the ability to quantify the opportunity of improving each of those outcomes.
For example, you can quantify the additional customer retained from fewer problems, higher complaint rates and/or higher problem resolution rates.
Further, the business case can create urgency for investment by quantifying the revenue left on the table for each month that the status quo continues — by quantifying the monthly cost of not investing in technology and improved CX, you create the incentive to act.
Need more convincing? We’ve put together a workbook that shows you how to operationalize these new concepts — the results should dazzle any CFO!