

Got some gaps in your A/B testing knowledge? No worries — we have you covered.
Here you’ll find an A/B testing refresher and a list of fundamental concepts you should master and use when planning your next A/B test — or when communicating your online experiments’ findings.
Bookmark this page, so you can refer to it whenever you need to. (And not because there’ll be a test at the end. Read on to find out if I’m kidding!)
Let’s start down the rabbit hole.
What Is A/B Testing?
Of course, the obvious place to start is by defining what an A/B test is. A/B tests are now a standard tool for data scientists. When you browse on Netflix or Amazon, there’s a good chance you’re part of one or more experiments.
An A/B test (also known as bucket testing or split testing) is the simplest kind of online controlled experiment. A/B tests set up a randomized allocation of visitors to two variants and compare the Conversion Rate, Clickthrough Rate, Revenue per Visitor, or a different Overall Evaluation Criterion (OEC), and see which one performs more successfully.
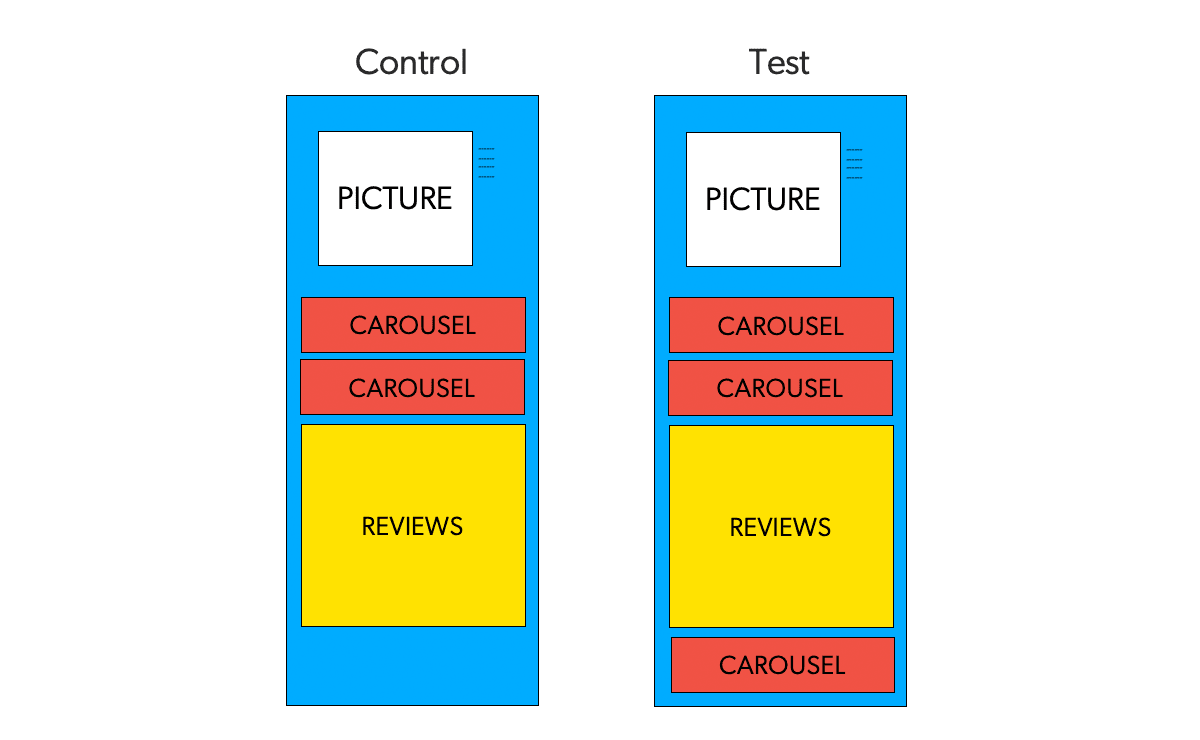
For example, to establish whether showing more recommendations to shoppers will result in a higher Revenue per Visitor (RPV), you might want to show some of your visitors two recommendation widgets — while showing three to the rest.
By virtue of random assignment, this randomized control allows you to test for causal relationships and help establish whether the shifts in metrics are caused by changes. In fact, researchers use the same approach of Randomized Controlled Trials to determine treatment in medicine.
But What Are Random Assignments?
You’ve probably heard many times that Randomized Controlled Trials are considered the best way for seeking truth. They’re generally regarded as the gold standard because they deliver the highest level of evidence.
Importantly, by virtue of randomization or random assignment, A/B tests are extremely powerful tools to establish causality in experimental research. But what exactly is a random assignment?
This simply means that every subject is as likely as any other to be assigned to any group. This is a fundamental aspect of online experiments. By setting up a randomized allocation of visitors to each variant, you can ensure your A/B test is highly controlled. It ensures that no pattern exists between the assignment of subjects into groups and any characteristics of those subjects.
For example, if subjects exposed to Variant A were more likely to be returning shoppers than subjects exposed to Variant B, it would be hard to determine whether the higher Conversion Rate reported in the A/B test is due to the change in re-ranking algorithm in my search page (i.e. the only difference between Variant A and B), rather than, say, returning shopper’s higher propensity to convert.
Randomization of experiments is thus key to controlling for confounding variables, where the latter are exactly what they sound like – variables within your A/B test that will mess with the results. These are attributes that are correlated with both the OEC and the parameter.
Well, What’s A Variant, Exactly?
A variant is a user experience being tested during an online experiment. During an A/B test, some visitors will see Variant A. The rest see Variant B instead. These two variants are identical, except for one variation that might affect the user’s behavior.

For instance, in the example above, assuming a 50–50 traffic split, half of the visitors might experience variant A, whereas the other half will be exposed to variant B.
Can You Explain Overall Evaluation Criterion (OEC)?
A key challenge for organizations that run A/B tests is choosing the right OEC. An OEC is a quantitative measure of the experiment’s objective. In non-online experimental research, it’s traditionally known as a dependentvariable.
Your OEC might be Conversion Rate or Average Order Value. But it can be Units Purchased, Revenue, Profit, Expected Lifetime Value, or some weighted combination of these.
Where Do Parameters Come In?
A controllable experimental variable that is thought to influence the OEC is referred to as a parameter. In non-online experimental research, it is traditionally known as an independent variable.
This is the variable the experimenter manipulates or changes. It’s assumed to have a direct effect on the dependent variable (OEC). For example, allocating visitors to either personalized or non-personalized listing page conditions (parameter) in order to measure any changes in the Conversion Rate (OEC).
When Do You Stop An A/B Test?
This is what we call a stopping rule. You’ve come up with your experimental hypothesis, parameter and overall evaluation criterion. Now, an important question to ask when planning an A/B test is for how long this should last. This decision shouldn’t be arbitrary. It also shouldn’t be based on reaching statistical significance.
Statistical significance is key but it shouldn’t dictate when you stop a test. It only tells you if there is a difference between your control and your variations.
Remember: you shouldn’t wait for a test to be significant (because it may never happen) or stop a test as soon as it is significant. Instead, you need to wait for the calculated sample size to be reached before stopping a test.
Instead, use a test duration calculator to better understand when to stop a test.
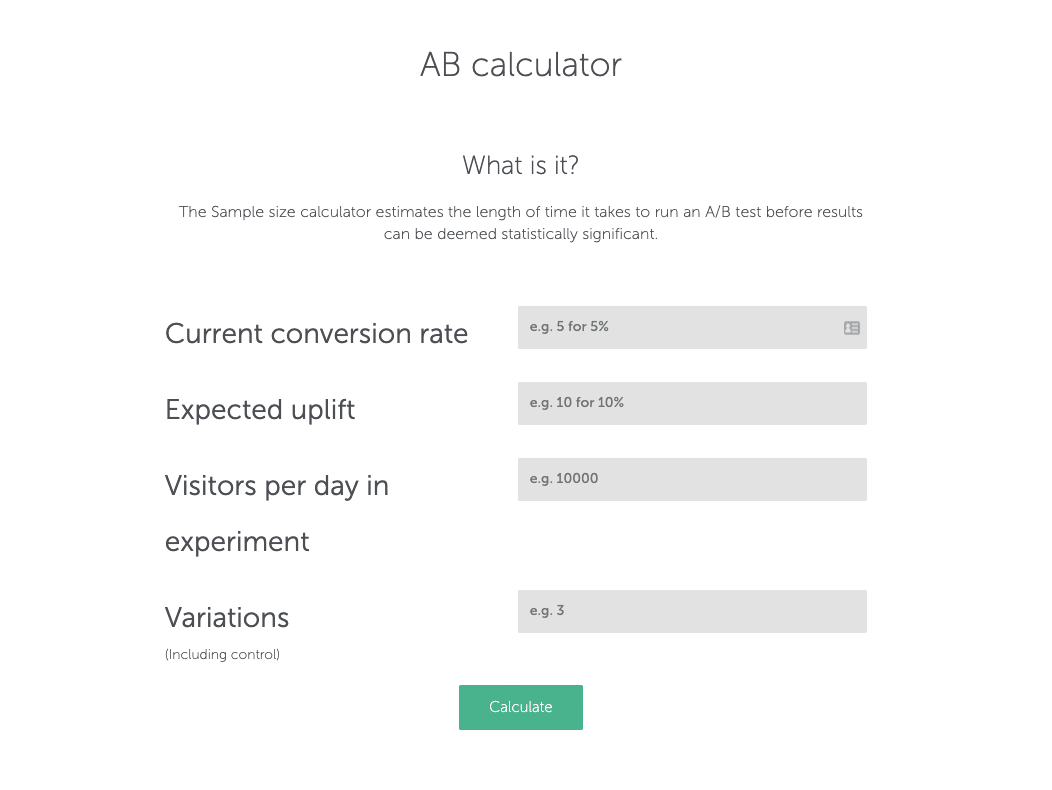
Sample size calculators like the one above consider a number of elements to figure out the necessary sample size, such as the desired level of statistical significance, the minimum relative exchange in the Conversion Rate one would like to be able to detect, the control’s group Conversion Rate and statistical power, which is the probability of a test to detect an effect when one exists.
I’ve Heard About This Thing Called A Flicker Effect
Ah, you’re one of those. (Just kidding.)
While running A/B tests sounds incredibly easy, there are potential problems you shouldn’t overlook. During A/B tests, for example, a situation may occur where the original (control) page appears for an instant before the variation (treatment) appears. This is called a Flicker Effect or a Flash of Original Content (FOOC).
The effect can be caused by the loading of the testing script itself. It appears the moment before the script becomes available and is ready to execute the necessary changes to load your A/B test. It represents a critical challenge to the validity of A/B tests.
Be aware that these events impact the experience for visitors and can lead them to abandon your site, hurting your test results, and overall engagement with consumers.
What About Internal and External Validity?
More broadly, there are two types of threats to an experiment’s validity, namely internal and external validity.
Internal validity refers to how much confidence you have in the result of your A/B test and to what degree the results are attributable to the changes introduced in the treatment — and not some other explanation.
For example, in the case of FOOC, we might have failed to detect a causal effect of serving personalized query suggestions — because in fact users that were supposedly assigned to the treatment variant were also exposed for a fraction of time to the control variant. It’s always important to set some guardrail metrics to monitor the validity of the experiment.
External validity refers to the extent to which the results of a study can be generalized. It deals with biases that stem from differences between the population in the experiment — and the population on which the learnings from the test are applied.
For instance, one should pay attention to day-of-week effects. You may have a different population of users on weekends than on weekdays, so it’s important to ensure that your experiment captures the weekly cycle. It’s always important to try and capture weekly cycles.
What About Biases In A/B Testing?
Biases refer to a class of effects that can pose threats to the internal and external validity of A/B tests.
For instance, novelty biases should always be recognized during an A/B test. The novelty bias comes into play when you make an alteration that your typical visitor isn’t used to seeing. If you change the navigation on your website, experienced users may be less efficient until they get used to the new navigation.
Conversely, when a new feature is introduced, some users will investigate it, click everywhere. Is the change in Conversion Rate really a result of the change between Variants A and B? Or perhaps we failed to detect a significant uplift because of a novelty bias?
Basically, when running A/B tests, returning customers can react in completely unnatural ways to how they normally would just because the feature and experience is new.
What Kind of Safeguards Can I Add To My A/B Tests?
Guardrail metrics are metrics that are designed to protect the business and alert experimenters about any potentially misleading or erroneous results and analysis.
During the experiment you should check for blatant violations of important metrics, such as sharding (e.g., is the 50:50 ratio respected in practice?) or timing (e.g., is one variant slower?).
If you notice an anomaly, you should check and stop the experiment if the problems are so high as to jeopardize the final outcome.
What About Standard Deviation?
Standard deviation refers to a measure that is used to quantify the amount of variation or dispersion of a set of data values for OEC. In other words it represents how ‘spread-out’ the data points are.
Where Do Inferential Statistics Come Into Play?
The purpose of A/B testing in ecommerce is to perform a controlled test of a hypothesis and make the most informed decision. To assess the A/B testing results we rely on inferential statistics.
Inferential statistics tells us about the likelihood that any differences between our experimental groups are “real” and not just random fluctuations due to chance.
There are two main approaches to inferential statistics, namely the Frequentist approach based on Null Hypothesis Significance Testing and the Bayesian approach.
Let’s get into each.
What’s Null Hypothesis?
The backbone of A/B testing is the Frequentist statistical theory of Null Hypothesis Statistical Testing (NHST). Since its introduction nearly 90 years ago, NHST has been the most widely used statistical approach to data analysis.
Experimenters using NHST summarize the test result in p-values, where the latter are used to decide whether to accept or reject a null hypothesis (which typically states that there is no difference between the two variants).
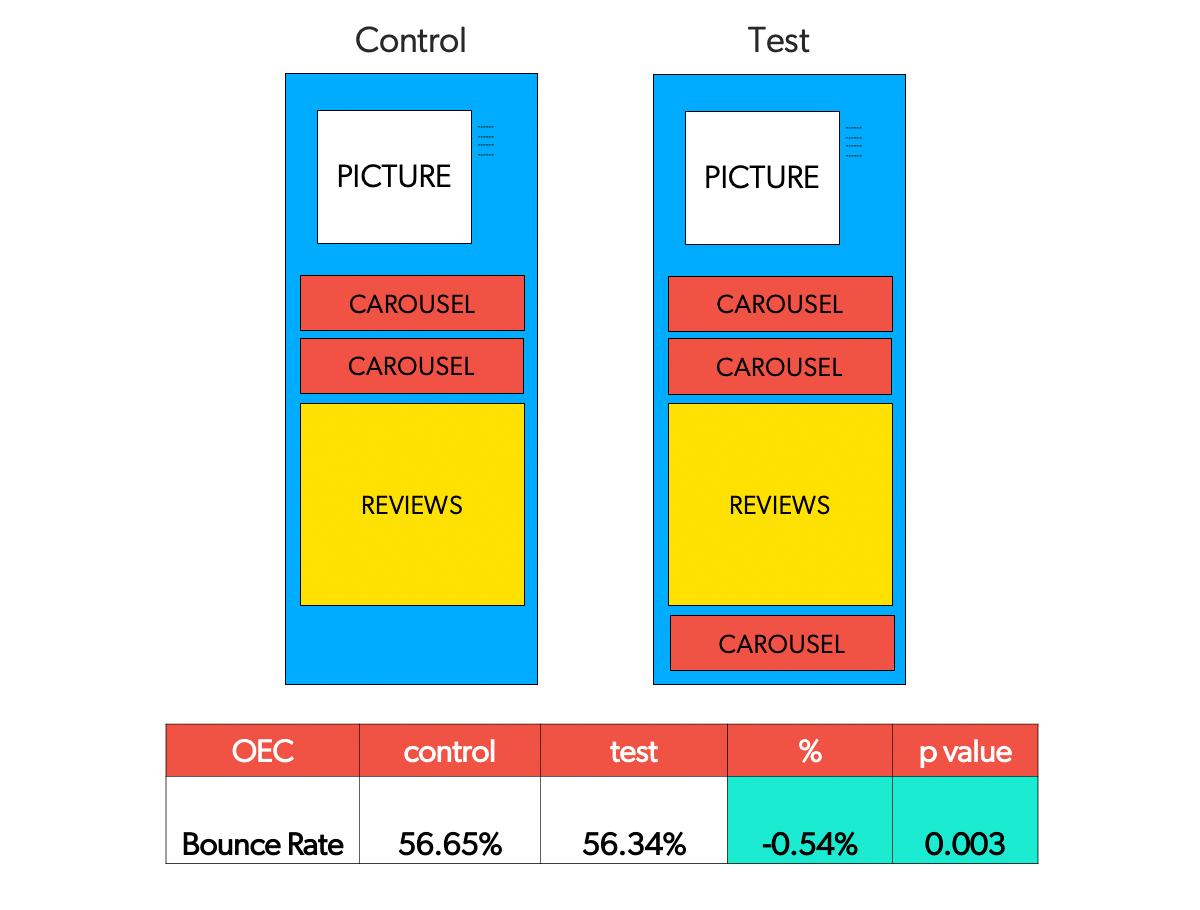
Recall our example from above, where we want to show some of the visitors two recommendation widgets — and three to the rest. Our null hypothesis H0 might be that the two designs A (control) and B (treatment) have the same efficacy, i.e. that they produce an equivalent bounce rate.
If the null hypothesis is rejected, this gives grounds for accepting the alternative hypothesis (that a relationship does exist between two variables).
What’s a P-value?
The p-value is the probability of observing a given test statistics – for example, the difference in Conversion Rate, assuming that the null hypothesis is true. The value is then compared against a predetermined significance level (α): if the reported p-value is smaller than α, the result is considered statistically significant. The intuition is that very unlikely results are probably produced by the experiment and not simply by chance.
Typically, in the social sciences α is set at 0.05, although the scientific community now recommends stricter thresholds for statistical significance. . For example, recall the A/B test involving the presentation of two vs three recommendation widgets.
The results of the A/B test below show that the improvement drove not only a reduction in bounce rate, but also that the p-value was lower than 0.05, thus reaching statistical significance.
[If all this sounds confusing, you aren’t alone. Studies indicate that students as well as academicians often do not interpret p-values correctly.]
I Heard About These Things Called Type I Errors.
Within the framework of Null Hypothesis Significance Testing (NHST), Type I errors (also known as Alpha (α) errors or false positives) entail that your A/B test seems to be succeeding, and your variation seems to cause an impact (better or worse) on the goals defined for the test.
However, the uplift or drop is, in fact, only temporary and is not going to last once you deploy the winning version universally and measure its impact over a significant period.
In the example above, for instance, we may have found a CTR uplift that seems to be real and yet would likely not be found again should we repeat our experiment.
Are There Type II Errors, Too?
Yes; the opposite can also happen. Also known as Beta (β) errors or false negatives, in the case of Type II errors, a particular A/B test seems to be inconclusive or unsuccessful, with the null hypothesis appearing to be true.
In reality, however, the variation impacts the desired goal, but the results fail to show, and the evidence favors the null hypothesis. You, therefore, end up (incorrectly) rejecting your experimental hypothesis.
Type II errors usually lead to the abandonment and discouragement of tests but, in worst cases, lack of motivation to pursue the Conversion Rate Optimization roadmap as one tends to disregard the efforts, assuming it to have made no impact.
Tell Me About Bayesian Statistics.
Bayesian theory is an alternative paradigm of statistical inference to frequentism, of which Null Hypothesis Significance Testing (NHST) is part of.
While frequentists quantify the probability of the data given the null hypothesis (P(D|H0)), Bayesians calculate the probability of the hypothesis given the data (P(H1|D)).
NHST largely remains the dominant approach, but it has become apparent that Bayesian offers a more intuitive interpretation of the resulting distribution in terms of probability. It also makes considerations about sample size and stopping rules a bit less concerning.
What About Frequentism?
Statistical thinking is essential to understanding the results of your A/B test, and the most popular approach to A/B testing has typically been a Frequentist one. It’s also the model of statistics taught in many university classes.
A Frequentist approach never uses or calculates the probability of your hypothesis. Basically, a Frequentist method makes predictions on the underlying truths of the experiment using only data from the current experiment.
The most common framework within frequentism is known as Null Hypothesis Significance Testing (NHST). This is where you start with the (null) hypothesis that there is no difference between Variants A and B. The most widely known concept is that of p-value (or probability value, which we discussed above), which you will end up with at the end of your experiment.
Why Would I Need Meta-analysis?
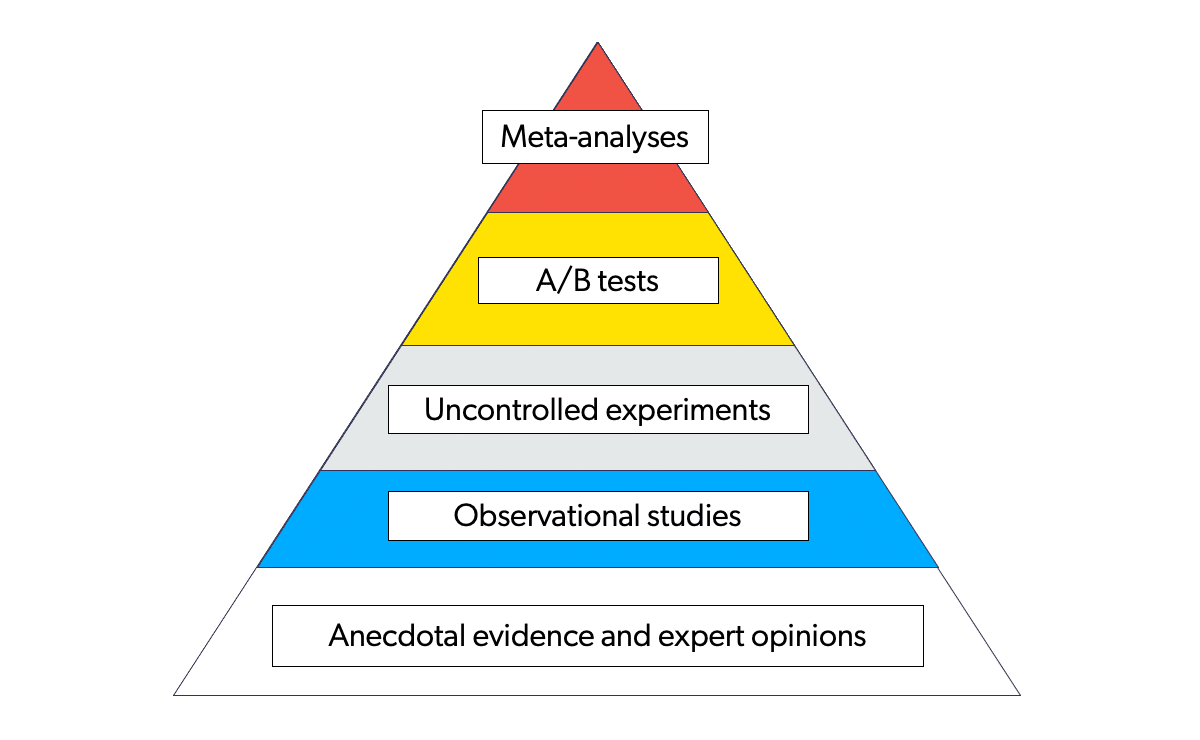
A meta-analysis is a statistical analysis that combines the results of multiple scientific studies. Meta-analyses can be performed when there are multiple scientific studies addressing the same question, with each individual study reporting measurements that are expected to have some degree of error.
For example, Coveo-Qubit performed the largest meta-analysis of A/B tests in ecommerce. This is considered to be the strongest level of evidence and is the standard of pharmaceutical companies to get a drug approved.
What Should I Remember About Twyman’s Law?
If the data is too good to be true, it’s probably wrong. Twyman’s law states that any data or figure that looks interesting or different is usually wrong. Surprising results should (attempt to) be replicated.
How Does A/B/n Testing Differ From A/B Testing?
Recall that A/B testing is where two versions of a page (remember our Variant A and Variant B) are tested against each other.
An A/B/n test is an extension of that, where more than two versions of a page are compared against each other at once. “N” refers to the number of versions being tested.
Should I Get Into Multivariate Testing?
Multivariate testing is a technique for testing a hypothesis in which multiple variables are modified.
The goal of multivariate testing is to determine which combination of variations performs the best out of all of the possible combinations. Ecommerce websites are made of combinations of changeable elements.
A multivariate test will change multiple elements, like changing the number of recommendation widgets and the addition of product badges at the same time. These variations are combined to create multiple versions of the content, which are tested concurrently to find the winning variation.
Test with care! When you test many variations at the same time, you run into what’s known as cumulative alpha error. Basically, the more test variants you run, the higher the probability of false positives.
Ready for the A/B Test … Test?
While this list isn’t exhaustive, it is a pretty comprehensive collection of fundamental concepts you should know when implementing A/B tests. If you have questions about something we didn’t cover here (or even if we did), reach out!
Looking to get your ecommerce site’s performance to the next level? Check out our Ultimate Guide to Conversion Rate Optimization for Ecommerce by downloading your copy today.