
Retailing has been a roller-coaster ride since COVID-19 prompted stay-at-home orders around the world in March 2020. Non-essential stores, from fashion and furniture to department stores and jewelers, were forced to close their doors for months, then change their operations to accommodate masking, social distancing, and intense sanitation. Grocers and mass merchandisers that stayed open quickly implemented buy online, pickup at curb (BOPIC) services, and home delivery, while ramping up to meet accelerated online shopping demand.
Vaccines arrived and restrictions eased in 2021, but supply chains that had been interrupted by the pandemic couldn’t keep up with demand. Going into 2022, retailers and consumers thought they could finally see a “new normal” on the horizon—until war and inflation started a new round of disruption.
Amid the latest uncertainties, digital retailers must stay on top of the pulse of the economy, consumer preferences, ecommerce search, and their own metrics with more rigor than ever.
To help ecommerce and omnichannel retailers (and reporters!) make better fact-based decisions, Coveo has done its own consumer surveys and scoured the internet for recent original research from more than 20 carefully vetted sources. We then organized that data into the following 10 key trends we think you need to know now.
You will definitely want to bookmark this page.
1. The Shape Of Ecommerce Shifts Again
- Worldwide, ecommerce sales surged 26.4% in 2020 to reach 17.9% of total retail revenue at a value of $4.25 trillion. In 2021, ecommerce growth slowed to 16.3%, and global ecommerce sales grew to $4.94 trillion. In January 2022, research firm eMarketer projected a 12.2% increase for global ecommerce for the upcoming year, for a total value of $5.54 trillion, representing 20.3% of retail sales globally. (Insider Intelligence/eMarketer Global Ecommerce Forecast, January 2022)
- In 2021, U.S. retail sales across all channels totaled $6.6 trillion, 17.9% higher than 2020’s revenues and representing one of the highest growth rates in U.S. retail history. For the first time since online retail sales were first tracked, physical retail growth outpaced ecommerce in the U.S. Sales in physical stores increased 18.5% while ecommerce grew 14.2%. (U.S. Department of Commerce Retail Indicator Division, as reported in Forbes, Feb 16, 2022)
- In February 2022, eMarketer published its projection that ecommerce sales in the U.S. would increase 14.1% this year. In July, the research firm revised its ecommerce growth projections downward by almost 5 percentage points to 9.4%. Its revised ecommerce sales total is $1.05 trillion for 2022, representing 15.0% of all retail sales rather than its earlier projection of 15.2%. (Insider Intelligence/eMarketer, US Ecommerce Forecast 2022, July 26, 2022)
- Also in July 2022, eMarketer recalibrated ecommerce growth projections for the coming years, lowering 2023’s growth rate from 13.8% to 12.1%, 2024’s from 13.4% to 12.3%, and 2025’s from 12.9% to 12.4%. While eMarketer projected in January that total ecommerce sales in 2025 would reach $1.51 trillion, its revised figure is 2.6% lower at $1.47 trillion. (Insider Intelligence/eMarketer, US Ecommerce Forecast 2022, July 26, 2022)

2. Consumers Respond To Tougher Times — Without Drastic Cutbacks
- Amid inflation and recession fears, consumers across the globe say the issues causing the greatest impact on their online shopping include rising prices for groceries (56%), being unable to purchase a product because it is out of stock (43%), products taking longer to be delivered than customers were told at time of purchase (42%), and delivery times from checkout being “longer than you would reasonably expect” (41%). (PwC June 2022 Global Consumer Insights Pulse Survey)
- Although 49% of shoppers across the U.S. and UK said this summer that they are shopping online about the same amount as before the pandemic, 37% are shopping online more and only 13% are shopping less. Both Gen Zers (46%) and millennials (41%) are more likely than other generations to say they are shopping online more. (Coveo Holiday in July 2022 Research Report)
- More than two-thirds (34%) of consumers worldwide purchased 10 or more items online in the first three months of 2022, and 13% spent more than $500 online monthly. (Brightcove/Ascend 2 Ecommerce Shopper Survey)
- Despite economic uncertainties, most (55%) consumers in the U.S. and UK do not expect to pull back on online shopping for the 2022 holidays, saying that they expect to do about the same amount of shopping online as they did in 2021. One-quarter plan to do more online shopping and only 14% anticipate doing less. (Coveo Holiday in July 2022 Research Report)
- Searches for “cheap holidays” have grown more than 400% globally and searches for “cheap and best” have grown 40% worldwide in 2022 over 2021. (Think with Google, “Global Insights Briefing: Conscious and cost-aware consumers,” July 2022)
- Consumers around the world are prioritizing practicality in 2022, with 86% reporting that the most important criteria for buying a brand are “functional reasons” rather than “emotional reasons” (71%). (NielsenIQ “Brand Balancing Act,” July 2022)

3. Customers Reject Bad Search, Taking Retail Sales With Them
- More than three-quarters (78%) of consumers typically use the search function on retail websites, making it the most common way to find products. Site search is used more frequently than the navigation menu (49%), filter feature (37%), and homepage recommendations (30%). (The Harris Poll on behalf of Google Cloud)
- Ninety percent of global consumers say a well-functioning site search box is “very important” or “absolutely essential” to the ecommerce experience, followed by the ability to filter results (74%), the ability to sort content in multiple ways (64%), and the visual appeal of a website (60%). (The Harris Poll on behalf of Google Cloud)
- In 2021, U.S. retailers lost an estimated $333 billion to bad search. This was calculated by multiplying the mean number of times (4) the onsite search function did not provide the item the consumer was looking for within the past month by the median cost ($32) of the last item searched for multiplied by 12 months and 217 million online consumers, per the U.S. Census. (The Harris Poll on behalf of Google Cloud)
- What is “bad” search? Baymard Institute, which studies consumers’ digital user experience (UX), says the eight most important ecommerce search query types are exact (product’s title or model number), product type or category, symptom (problem to solve), non-product (e.g., the return policy or shipping information), feature (product attributes such as color, price, brand, and size), thematic (e.g., holidays, special occasions, or “on sale”), compatibility (e.g., product accessory or replacement), and slang/abbreviation/symbol queries. And Baymard found that 42% of all sites “perform below acceptable e-commerce search UX performance across the eight e-commerce search query types.” (“Deconstructing E-Commerce Search UX, The 8 Most Common Search Query Types,” July 14, 2022)
- When asked what would make them most likely to leave a brand’s website without making a purchase, the top three reasons were “can’t find what I’m looking for” (68%), “can’t easily navigate across site” (51%), and “limited shipping options and/or no local store pick-up” (42%). Overall, 82% said either “can’t find what I’m looking for” or “can’t easily navigate across site.” (Coveo Holiday in July 2022 Research Report)

4. Tracking Ecommerce Benchmarks Is Essential During Downturns
- On average, online retail is more profitable than other retail sectors, with a 41.5% gross margin (the amount of money left after deducting the cost of goods sold from revenue, expressed as a percent of sales) and a 7.3% net margin (how much income or profit is generated when all business expenses are deducted, expressed as a percentage of revenue.) In comparison, grocery & food retail delivers a gross margin of 25.7% and a net margin of 1.1%, and specialty retail—which covers the spectrum of category-specific retailers, including clothing and accessories, electronics, home goods, pet products, sporting goods, etc.—averages 30.9% gross margin and 4.5% net margin. (New York University Stern School of Business, as of January 2022)
- The average conversion rate—the percentage of visitors who complete a desired action—for commercial websites of all types, worldwide, was 2.3% for full-year 2021, with the conversion rate on a desktop/laptop (3.0%) almost double the conversion rate on mobile devices (1.6%). Among ecommerce categories, grocery achieved a 6.8% conversion rate; health & beauty, 3.9%; fashion, 3.3%; home goods & and home furnishings, 2.8%; and consumer electronics, 1.4%. (Contentsquare 2022 Digital Experience Benchmark Report)
- More than two-thirds (68.8%) of online shoppers put products into their carts but don’t check out—cart abandonment, as the metric is known—but keep in mind that more than half (58.6%) of U.S. online shoppers didn’t make a purchase in a given session because they weren’t ready or “just browsing.” Of those who came to a site ready to buy, the largest portion (48%) left because of extra costs (shipping, fees, taxes), followed by needing to create an account (24%), and because delivery would be too slow (22%). (Baymard Institute, Reasons for Cart Abandonment, 2022 data)
- An overwhelming 91% of shoppers encountered at least one problem when shopping online in 2022, with top issues including slow websites (35%), not finding what they want (34%), and disorganized site or app navigation (29%). (Coveo Ecommerce Relevance Report 2022)

5. Omnichannel Shopping Gains Strength From Pandemic
- More than 6.4% of U.S. and European households are now both online and in-store (omnichannel) grocery shoppers, a share that has risen 60% from pre-pandemic levels. Omnichannel grocery shoppers are shown to have higher shopping frequency and basket size than the average shopper, resulting in an incremental spend of 16%. (Symphony RetailAI)
- Retailers with omnichannel services are more likely to convert website visits into purchases. Among retailers ranked in the Digital Commerce 360 Top 1000, those that offered curbside pickup and/or buy online, pickup in store (BOPIS) services had a median conversion rate of 3.2%, as compared to a 2.7% conversion rate for Top 1000 retailers offering neither. (Digital Commerce 360, 2022 Conversion Report)
- Grocery shoppers expect omnichannel retailers to have raised their game online during the pandemic. If a new website user does not have an excellent customer experience in the first online shopping visit, 40% of customers will not return to the site. When they go back to that retailer’s physical store, they will spend almost 3% less than previously. (Symphony RetailAI)
- More than half (55%) of shoppers worldwide want to browse products online and check what’s available in local stores. (Shopify, The Future of Commerce Trend Report 2022)
- Almost half (49%) of U.S. shoppers said having a local presence (retail location) was a “significant” or “very significant” influence on which brands they chose to purchase from. (Shopify, The Future of Commerce Trend Report 2022)
- Omnichannel shopping is a two-way street, with 54% of consumers saying they’re likely to look at a product online and buy it in store, and an almost identical number (53%) are likely to look at a product in store and buy it online. (Shopify, The Future of Commerce Trend Report 2022)
- More than one-third (35%) of companies are successfully achieving omnichannel personalization, up from 24% in 2021, with 60% of executives reporting that they are increasing their investment in personalization in 2022. (Twilio State of Personalization Report 2022)

6. Mobile Commerce Rides High With Increased Usage
- Sales via mobile devices are expected to represent 65.7% of worldwide ecommerce sales in 2022, for a total of $3.64 trillion. (Insider Intelligence/eMarketer Global Ecommerce Forecast, January 2022)
- In the U.S., mobile commerce revenues are expected to grow 17.3% over 2021 to reach $418.7 billion in 2022, representing 40.5% of total ecommerce spending. M-commerce is projected to increase 16.9% next year to reach $489.4 billion. By 2026, m-commerce will represent almost half (45.5%) of ecommerce sales at a value of $768.2 billion. (Insider Intelligence/eMarketer, US Ecommerce by Category 2022, February 2022)
- Mobile usage drives m-commerce. In the top 10 mobile countries, users spent 4 hours and 48 minutes on their phones and tablets in 2021, 30% more than in 2019. In the U.S., people spent an average of 4.1 hours each day on their mobile devices, one hour more than they spent watching TV. (Data.ai State of Mobile 2022)
- Globally, time spent in shopping apps in 2021 rose 18% year-over-year, with strong movement in fast fashion, social shopping, and big-box retailers. In the U.S., the collective time people spent with mobile shopping apps rose 12% in 2021. (Data.ai State of Mobile 2022)
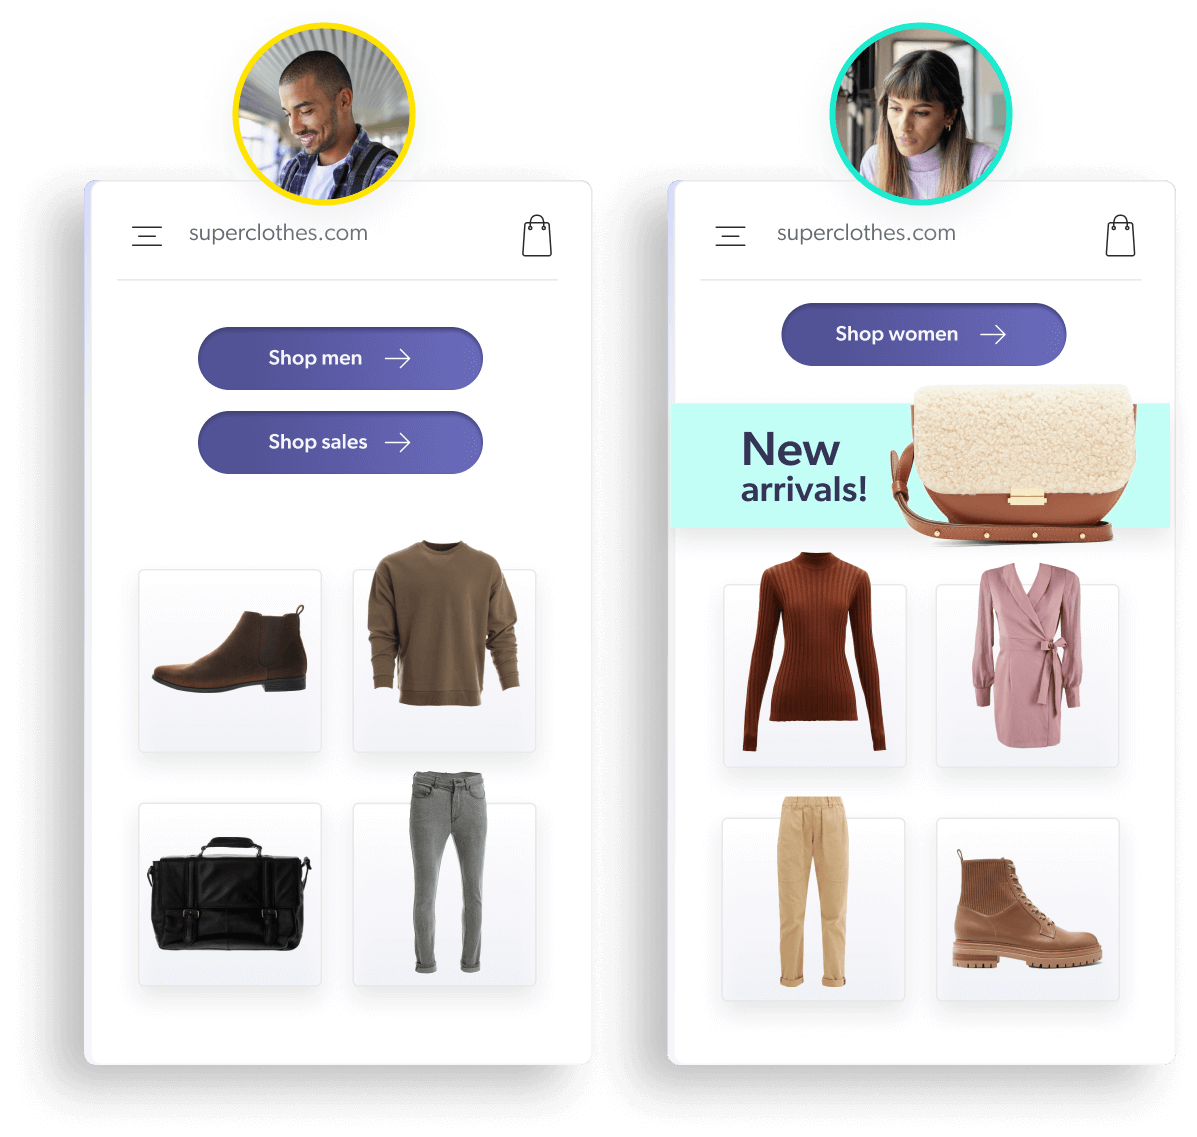
7. Shoppers Weigh Personal Privacy While Demanding Relevance And Personalization
- Even though 93% of customers expect their online experience to be equal to, if not better than, their in-store experience, only 6% of consumers in the U.S. and UK think their online shopping experiences are always relevant to their buying habits and preferences. (Coveo Ecommerce Relevance Report 2022)
- More than three-quarters of consumers (76%) said receiving personalized communications made them more likely to consider purchasing from a brand, and 78% said they are more likely to make repeat purchases from companies that personalize. (McKinsey Next in Personalization 2021 Report)
- When it comes to personalized communications and products/services, 71% of consumers expect brands and businesses to deliver experiences tailored to them, and 76% get frustrated when this doesn’t happen. (McKinsey Next in Personalization 2021 Report)
- Across the U.S. and UK, the two main personalized shopping tools consumers want are “tailored offers / discounts / promotions” (51%) and “top reviews / best seller notifications” (47%). Generation Z consumers are less likely to want “tailored offers / discounts / promotions” (42%) but most likely to want “top reviews / best seller notifications” (51%), along with “products recommended for you” (40%) and “virtual try-on tools” (34%). (Coveo Holiday in July 2022 Research Report)
- People have become wary of being identified as they surf the web. On ecommerce websites, 40% of visitors shop anonymously and use guest check-out. And although 59% of people say they are concerned about how their personal data is being used by retailers, there is a bright side: 51% of customers are likely to share that data with brands they trust. (Coveo Ecommerce Relevance Report 2022)
- Half of business leaders around the globe say recent changes to data privacy regulations have made personalization more difficult, and 40% say getting accurate customer data for personalization is a challenge. (Twilio State of Personalization Report 2022)

8. After Slow Start, Social Shopping Begins To Bloom
- More than one-quarter (27%) of consumers are interested in making purchases directly on social media channels when it is offered, but a significantly larger share (44%) of millennials and Gen Zs want to buy on social platforms. (Square/Wakefield Research Future of Retail)
- Although they prefer to buy on the site of the brand or retailer rather than social media platforms, 81% of online shoppers have problems when they click through from social media to a product detail page on the ecommerce site. Top issues are product availability (98%), broken links (30%), slow loading of the landing page (22%), error messages (19%), error pages (17%), and incorrect landing pages for the product (16%). (SimplicityDX, The State of Social Commerce 2022)
- While 48% of shoppers think social networks are “a great way to learn about new products,” only 13% prefer to checkout directly on a social media platform. Among shoppers who have discovered a product for sale on social media, 71% go to the retailer’s website to complete the purchase, and 16% have no preference; i.e., they will buy on either the brand’s site or the social media platform. (SimplicityDX, The State of Social Commerce 2022)
- Ecommerce retailers are responding to the growing acceptance of social media shopping, with 74% selling on one or more social channels, with the predominant share (59%) selling on Facebook, followed by Instagram (34%), Twitter (28%), and TikTok (18%). (Square/Wakefield Research Future of Retail)

9. Shoppers Gravitate To Novelty And Small Or Local Businesses
- Almost half (48%) of consumers globally say they plan to buy more from smaller brands in the future; 51% of consumers worldwide say small brands are more authentic and trustworthy than big brands, and 47% think small brands are usually more expensive, but they are prepared to pay a bit more for them. (NielsenIQ “Brand Balancing Act,” July 2022)
- Almost one-third (30%) of consumers in the U.S. and UK say they intend to shop new brands in the summer of 2022. Across the US, UK, and Ireland, 20% of consumers favor new brands so much that they are unlikely to purchase from familiar brands. (Conjura)
- Post-COVID, 95% of U.S. consumers agree that “it’s more important than ever” to shop at local businesses, and 35% said they had started purchasing from businesses they had not previously supported. (Square/Wakefield Research Future of Retail)

10. Shoppers Get The Last Word On What Helps Them Buy
- More than half (54%) of shoppers read online reviews for all products they buy, while only 5% of respondents don’t read any. More than one-quarter (26%) of online shoppers say that good reviews play the biggest role in their decision to make a purchase. (Digital.com)
- Consumers across the U.S., UK, and Ireland are more than three times as likely to rely on customer reviews rather than influencer reviews when making purchasing decisions. (Conjura)
- Seventy percent of consumers worldwide say that having access to video while they are considering an online purchase helps them to better understand the product or experience they are purchasing, and 48% say video content increases their confidence in a purchase. (Brightcove/Ascend2 Ecommerce Shopper Survey)
- Almost three-quarters (74%) of shoppers agree that photos taken by other shoppers increase their likelihood of buying a product. Over half (53%) say user-generated photography, as opposed to professional photography, makes them more confident in their purchase decision. (Bazaarvoice 2022 Shopper Experience Index)
How Does Your Ecommerce Experience Stack Up?
Much more goes into crafting an online retail experience than just throwing up a website and assuming customers will come. And you know that – so why not power your ecommerce experience with a leading relevance platform that matches customers to products, growing conversions?